前几天给大家分享了如何使用Locust进行性能测试,但是在实际使用中会发现存在压测的结果无法保存的问题,比如在分布式部署情况下进行压测,每轮压测完成需要释放资源删除容器重新部署后,这段时间的压测结果就都丢失了,如果想要对比多次压测的结果,就需要在每轮压测完成后手动记录,非常不方便,而且Locust在压测过程中对于一些指标的展示也过于简单,不利于我们对测试结果的分析,接下来跟大家分享使用Locust + Prometheus实现数据持久化,并且用Grafana创建性能测试仪表,希望能给大家的测试工作带来帮助。
关于Docker,在本文中就不做介绍了,之前给大家分享过一篇关于Docker介绍与安装的文章:
Docker在Windows与CentOS上的安装
Prometheus用途:
Prometheus是一个开源的监控和警报工具,用于收集、存储和查询各种类型的时间序列数据。它可以监控服务器、应用程序和网络服务的性能指标,以便管理员能够及时发现问题并采取相应的措施。Prometheus系统还可以通过配置警报规则来实时监测系统的状态,并在发现异常情况时发送警报通知。这使得管理员能够快速响应并解决问题,确保系统的稳定性和可靠性。
Grafana用途:
Grafana的主要用途是数据可视化和监控。它可以帮助用户通过创建各种图表和仪表板来可视化数据,从而更容易地理解数据、发现趋势和问题,并做出更明智的决策。Grafana还可以与各种数据源集成,包括数据库、云服务和监控系统,帮助用户监控系统的健康状况、性能和运行情况。总的来说,Grafana是一个功能强大的工具,可以帮助用户更好地理解和管理他们的数据和系统。
一、准备Docker环境
操作系统:CentOS 7
Python版本:3.8
Locust版本:2.1
通过yum安装docker
yum install -y docker
安装完成后,查看docker版本
docker -v
创建docker虚拟网络,docker虚拟网络可以让不同的docker容器在各自独立的网络环境中运行,相互之间不会干扰;还能方便容器之间进行通信,就像一个内部的“网络小世界”;并且能让容器与外部网络进行连接,实现数据的传输和交互。
docker network create locust_network
通过以下命令查看创建的网络
docker network ls
二、部署locust的Master节点
我们需要采用Locust的分布式部署,那么Master节点的主要作用是收集数据。那么就需要在Master节点服务器上启动Locust的master与prometheus。
非常感谢大佬开源了一个集成了集成了prometheus的locust的master节点代码,可以通过下面链接下载:
https://github.com/myzhan/boomer/blob/master/prometheus_exporter.py
如果下载遇到问题,也可以直接使用下面代码:
# -*- coding: utf-8 -*-
import six
from itertools import chain
from flask import request, Response
from locust import stats as locust_stats, runners as locust_runners
from locust import User, task, events
from prometheus_client import Metric, REGISTRY, exposition


class LocustCollector(object):
    """
    用于收集Locust的指标数据,并且以Prometheus格式导出
    """
    registry = REGISTRY

    def __init__(self, environment, runner):
        self.environment = environment
        self.runner = runner

    def collect(self):
        '''
        该方法用于收集指标数据,并生成相应的Prometheus指标,只在locust状态为spawning或者running时收集指标。
        '''
        runner = self.runner
        if runner and runner.state in (locust_runners.STATE_SPAWNING, locust_runners.STATE_RUNNING):
            stats = []
            for s in chain(locust_stats.sort_stats(runner.stats.entries), [runner.stats.total]):
                stats.append({
                    'method': s.method,
                    'name': s.name,
                    'num_requests': s.num_requests,
                    'num_failures': s.num_failures,
                    'avg_response_time': s.avg_response_time,
                    'min_response_time': s.min_response_time or 0,
                    'max_response_time': s.max_response_time,
                    'current_rps': s.current_rps,
                    'median_response_time': s.median_response_time,
                    'ninetieth_response_time': s.get_response_time_percentile(0.9),
                    # 只有总统计数据可以使用current_response_time
                    # 'current_response_time_percentile_95': s.get_current_response_time_percentile(0.95),
                    'avg_content_length': s.avg_content_length,
                    'current_fail_per_sec': s.current_fail_per_sec
                })
            # 只在worker节点中起作用
            errors = [e.to_dict() for e in six.itervalues(runner.stats.errors)]
            metric = Metric('locust_user_count', 'Swarmed users', 'gauge')
            metric.add_sample('locust_user_count', value=runner.user_count, labels={})
            yield metric
            metric = Metric('locust_errors', 'Locust requests errors', 'gauge')
            for err in errors:
                metric.add_sample('locust_errors', value=err['occurrences'], labels={'path': err['name'], 'method': err['method'], 'error': err['error']})
            yield metric
            is_distributed = isinstance(runner, locust_runners.MasterRunner)
            if is_distributed:
                metric = Metric('locust_slave_count', 'Locust number of slaves', 'gauge')
                metric.add_sample('locust_slave_count', value=len(runner.clients.values()), labels={})
                yield metric

            metric = Metric('locust_fail_ratio', 'Locust failure ratio', 'gauge')
            metric.add_sample('locust_fail_ratio', value=runner.stats.total.fail_ratio, labels={})
            yield metric

            metric = Metric('locust_state', 'State of the locust swarm', 'gauge')
            metric.add_sample('locust_state', value=1, labels={'state': runner.state})
            yield metric
            stats_metrics = ['avg_content_length', 'avg_response_time', 'current_rps', 'current_fail_per_sec','max_response_time',
                             'ninetieth_response_time', 'median_response_time','min_response_time', 'num_failures', 'num_requests']
            for mtr in stats_metrics:
                mtype = 'gauge'
                if mtr in ['num_requests', 'num_failures']:
                    mtype = 'counter'
                metric = Metric('locust_stats_' + mtr, 'Locust stats ' + mtr, mtype)
                for stat in stats:
                    # aggregstat的方法标签是None,所以将它命名为aggregstat
                    if 'Aggregated' != stat['name']:
                        metric.add_sample('locust_stats_' + mtr, value=stat[mtr], labels={'path': stat['name'], 'method': stat['method']})
                    else:
                        metric.add_sample('locust_stats_' + mtr, value=stat[mtr], labels={'path': stat['name'], 'method': 'Aggregated'})
                yield metric

@events.init.add_listener
def locust_init(environment, runner, **kwargs):
    if environment.web_ui and runner:
        @environment.web_ui.app.route('/export/prometheus')
        def prometheus_exporter():
            registry = REGISTRY
            encoder, content_type = exposition.choose_encoder(request.headers.get('Accept'))
            if 'name[]' in request.args:
                registry = REGISTRY.restricted_registry(request.args.get('name[]'))
            body = encoder(registry)
            return Response(body, content_type=content_type)
        REGISTRY.register(LocustCollector(environment, runner))

class Dummy(User):
    @task(20)
    def hello(self):
        pass
1、下载完成后,将prometheus_exporter.py上传至当做master节点的服务器
2、启动Locust的Master节点
启动命令如下:
docker run -p 8089:8089 -p 5557:5557 -v $PWD/prometheus_exporter.py:/mnt/locust/locustfile.py --name=locust_master --network=locust_network --network-alias=locust_master locustio/locust -f /mnt/locust/locustfile.py --master
执行命令时,会自动下载镜像,可以不用执行docker pull。
对于这条命令的解释:
docker run:运行一个 Docker 容器。

-p 8089:8089 -p 5557:5557:将主机的 8089 端口和 5557 端口分别映射到容器的 8089 端口和 5557 端口。

-v $PWD/prometheus_exporter.py:/mnt/locust/locustfile.py:将当前工作目录下的prometheus_exporter.py文件挂载到容器的/mnt/locust/locustfile.py位置。

--name=locust_master:为容器命名为locust_master。

--network=locust_network:指定容器使用的网络为locust_network。

--network-alias=locust_master:为容器在网络中设置别名locust_master。

locustio/locust -f /mnt/locust/locustfile.py --master:指定使用locustio/locust镜像,并指定要运行的文件为/mnt/locust/locustfile.py,以主节点模式运行。
如果执行上面命令在启动容器时出现报错

说明容器里面没有安装prometheus_client库,需要进行手动安装。手动安装完成后可以重新打一个镜像,避免后续报错,此处先描述一下如何进行手动安装,首先我们要现将容器启动起来,然后进入容器内部进行包的安装。
编辑prometheus_exporter.py文件
vim prometheus_exporter.py
在文件的第二行添加两行代码,然后保存文件。
关于vim编辑器的使用可以参考之前给大家分享的linux常用命令:
作为测试人员的Linux常用命令
import os
os.system("tail -f /dev/null")
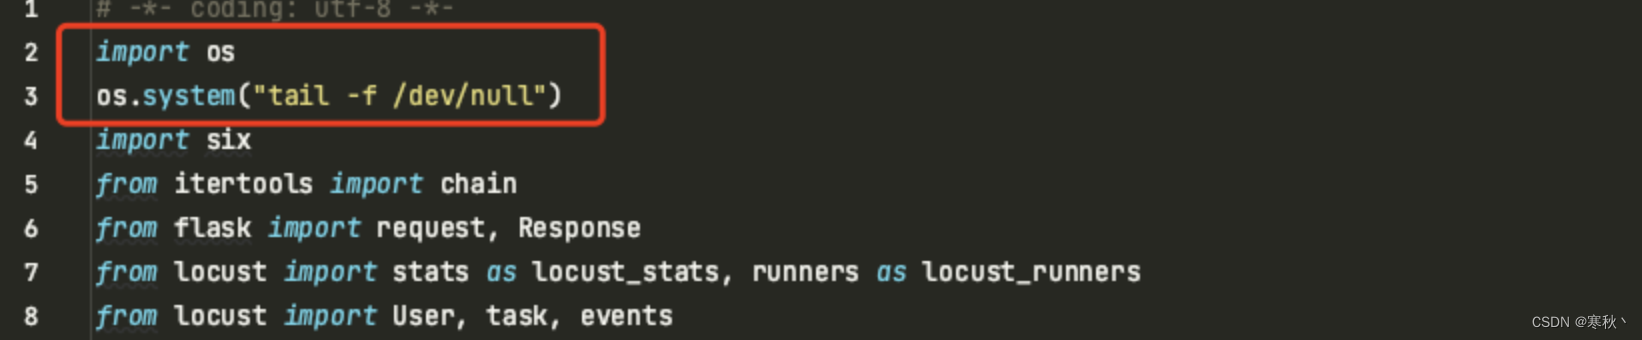
这两行代码的意思是使用os.system方法执行命令tail -f /dev/null,会持续追踪/dev/null文件的内容(实际上/dev/null是一个空设备,不会有实际内容)。一般用于在后台保持进程运行,这样容器就可以正常启动。
重启docker的master节点容器
docker restart locust_master
查看容器运行状态,locust_master容器启动成功。
docker ps -a
进入到locust_master容器中。
docker exec -it locust_master /bin/bash
进入容器后,使用pip安装prometheus_client包。
pip install prometheus_client
安装成功后,通过exit退出容器回到服务器上,再次使用vim编辑prometheus_exporter.py文件,删除刚刚添加的两行代码,保存文件。
还原prometheus_exporter.py文件后,再次重启master节点容器
docker restart locust_master
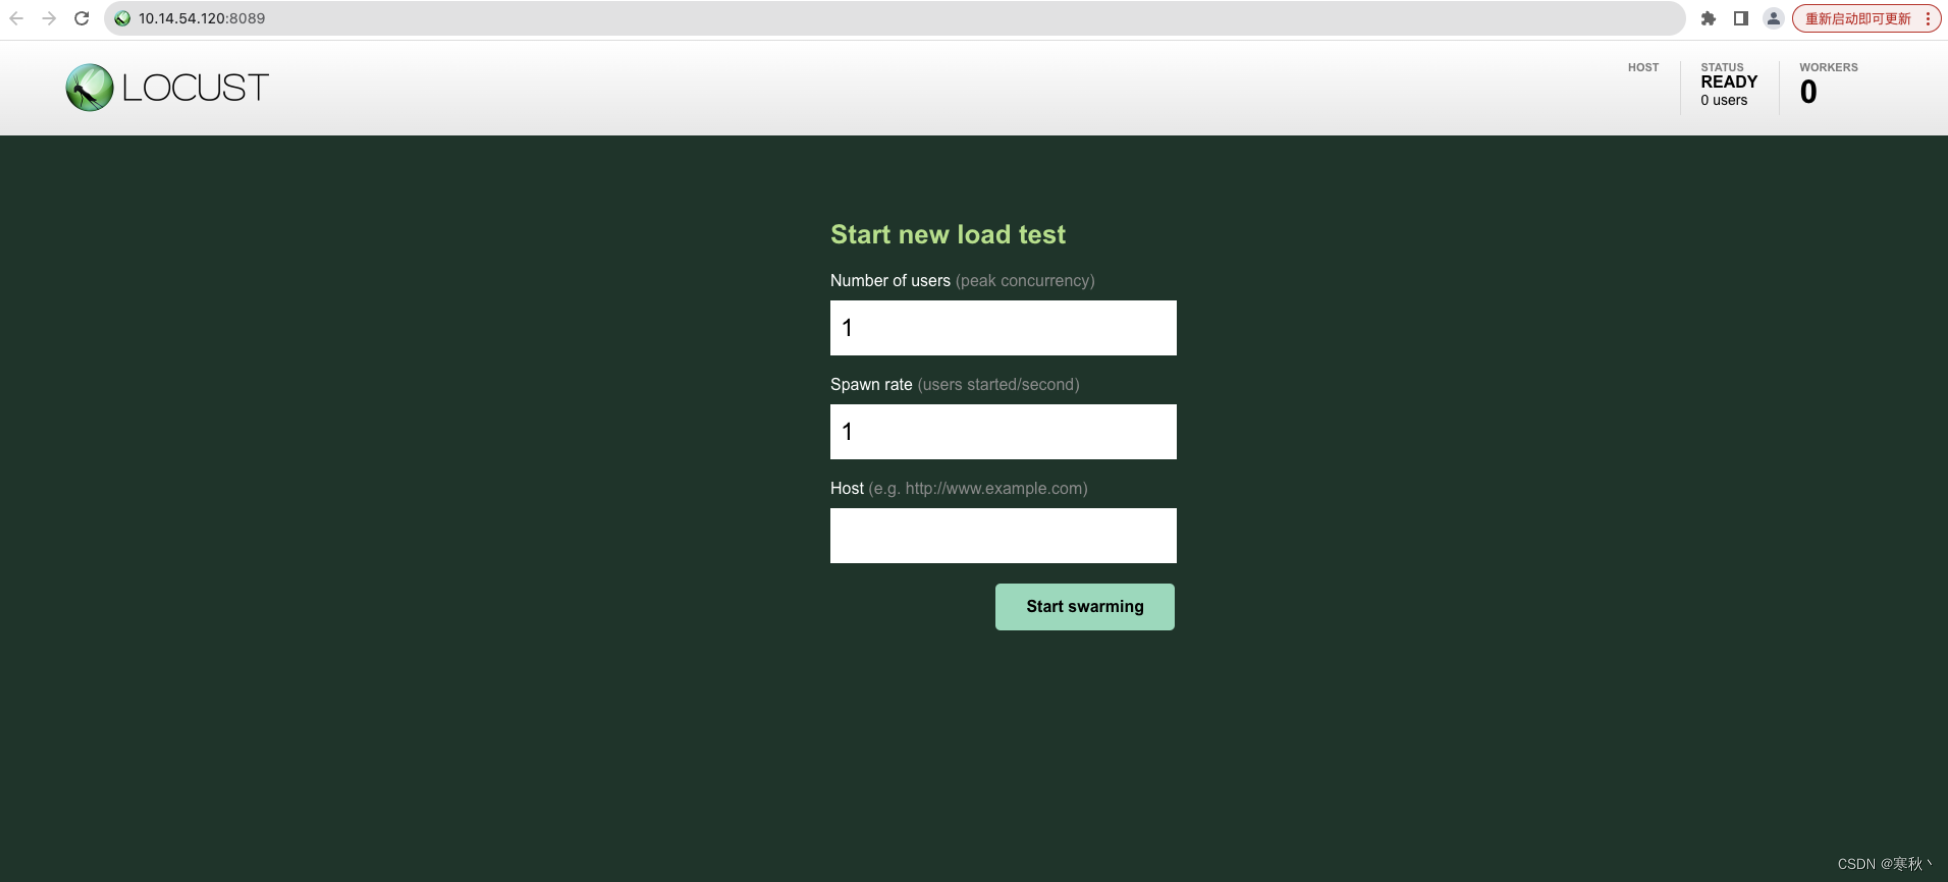
3、验证Locust的Master节点
重启完成后,打开浏览器,在浏览器输入http://master-ip:8089可以访问到locust的原生web页面。
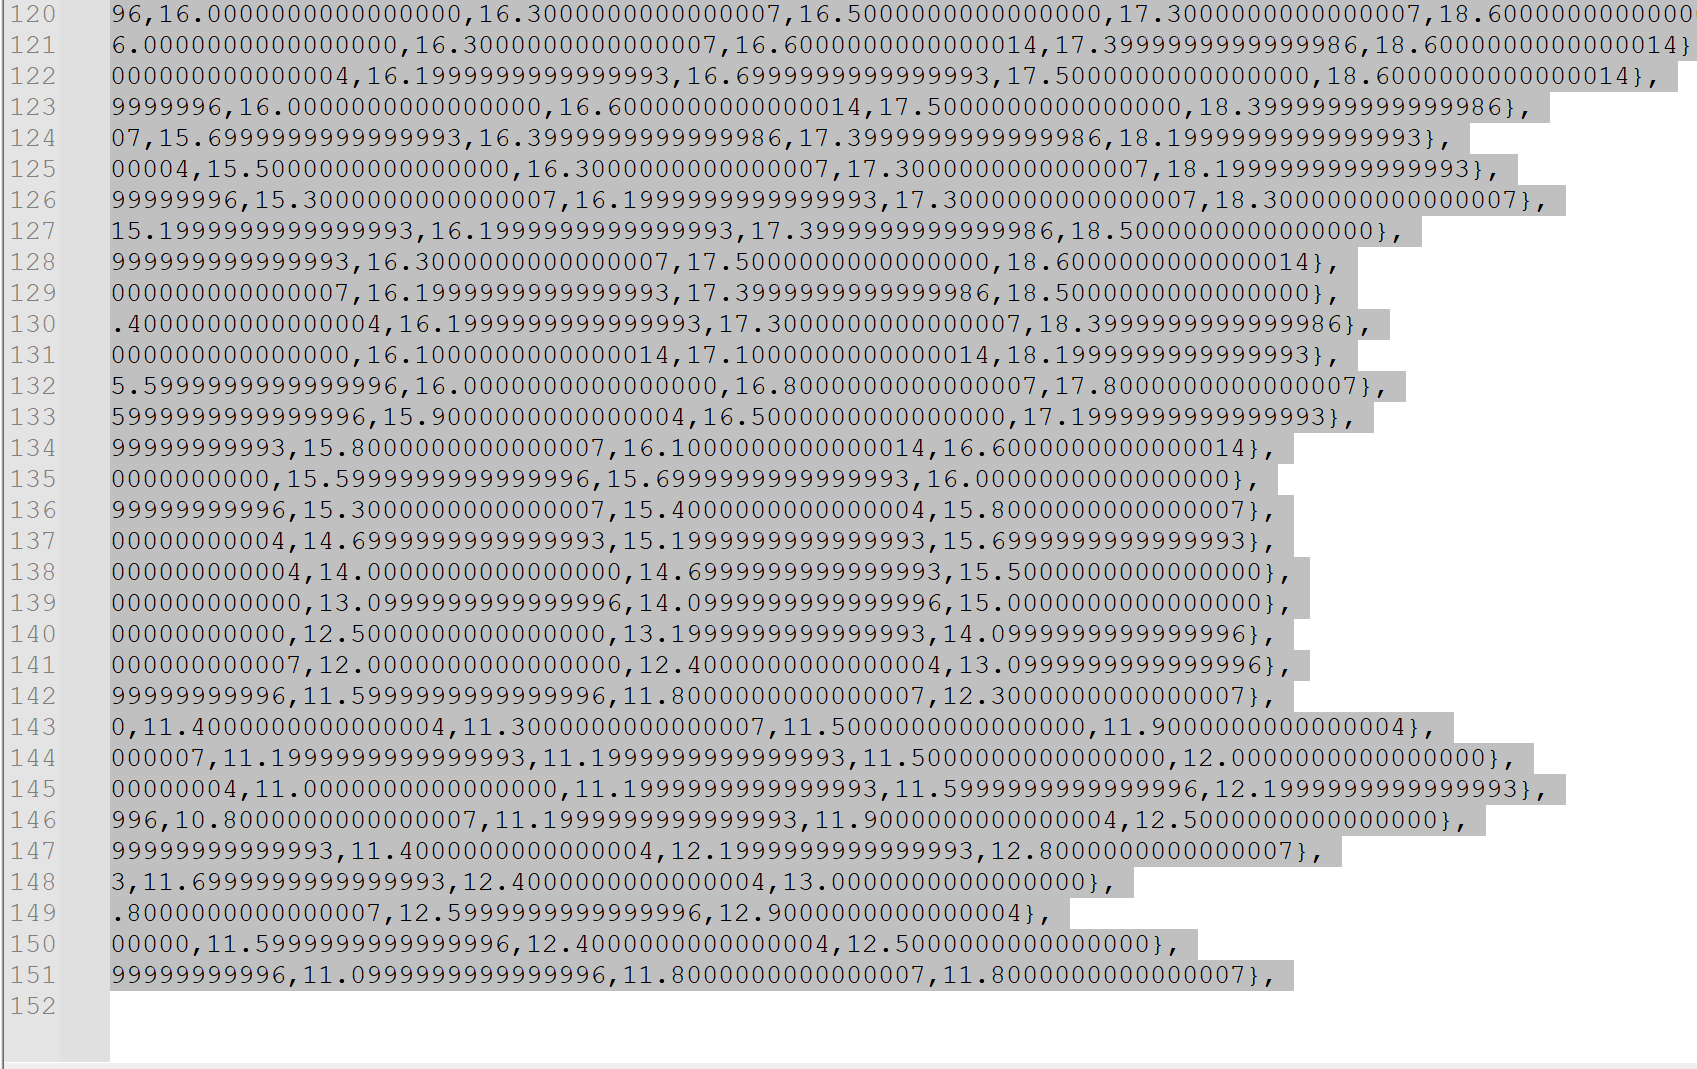
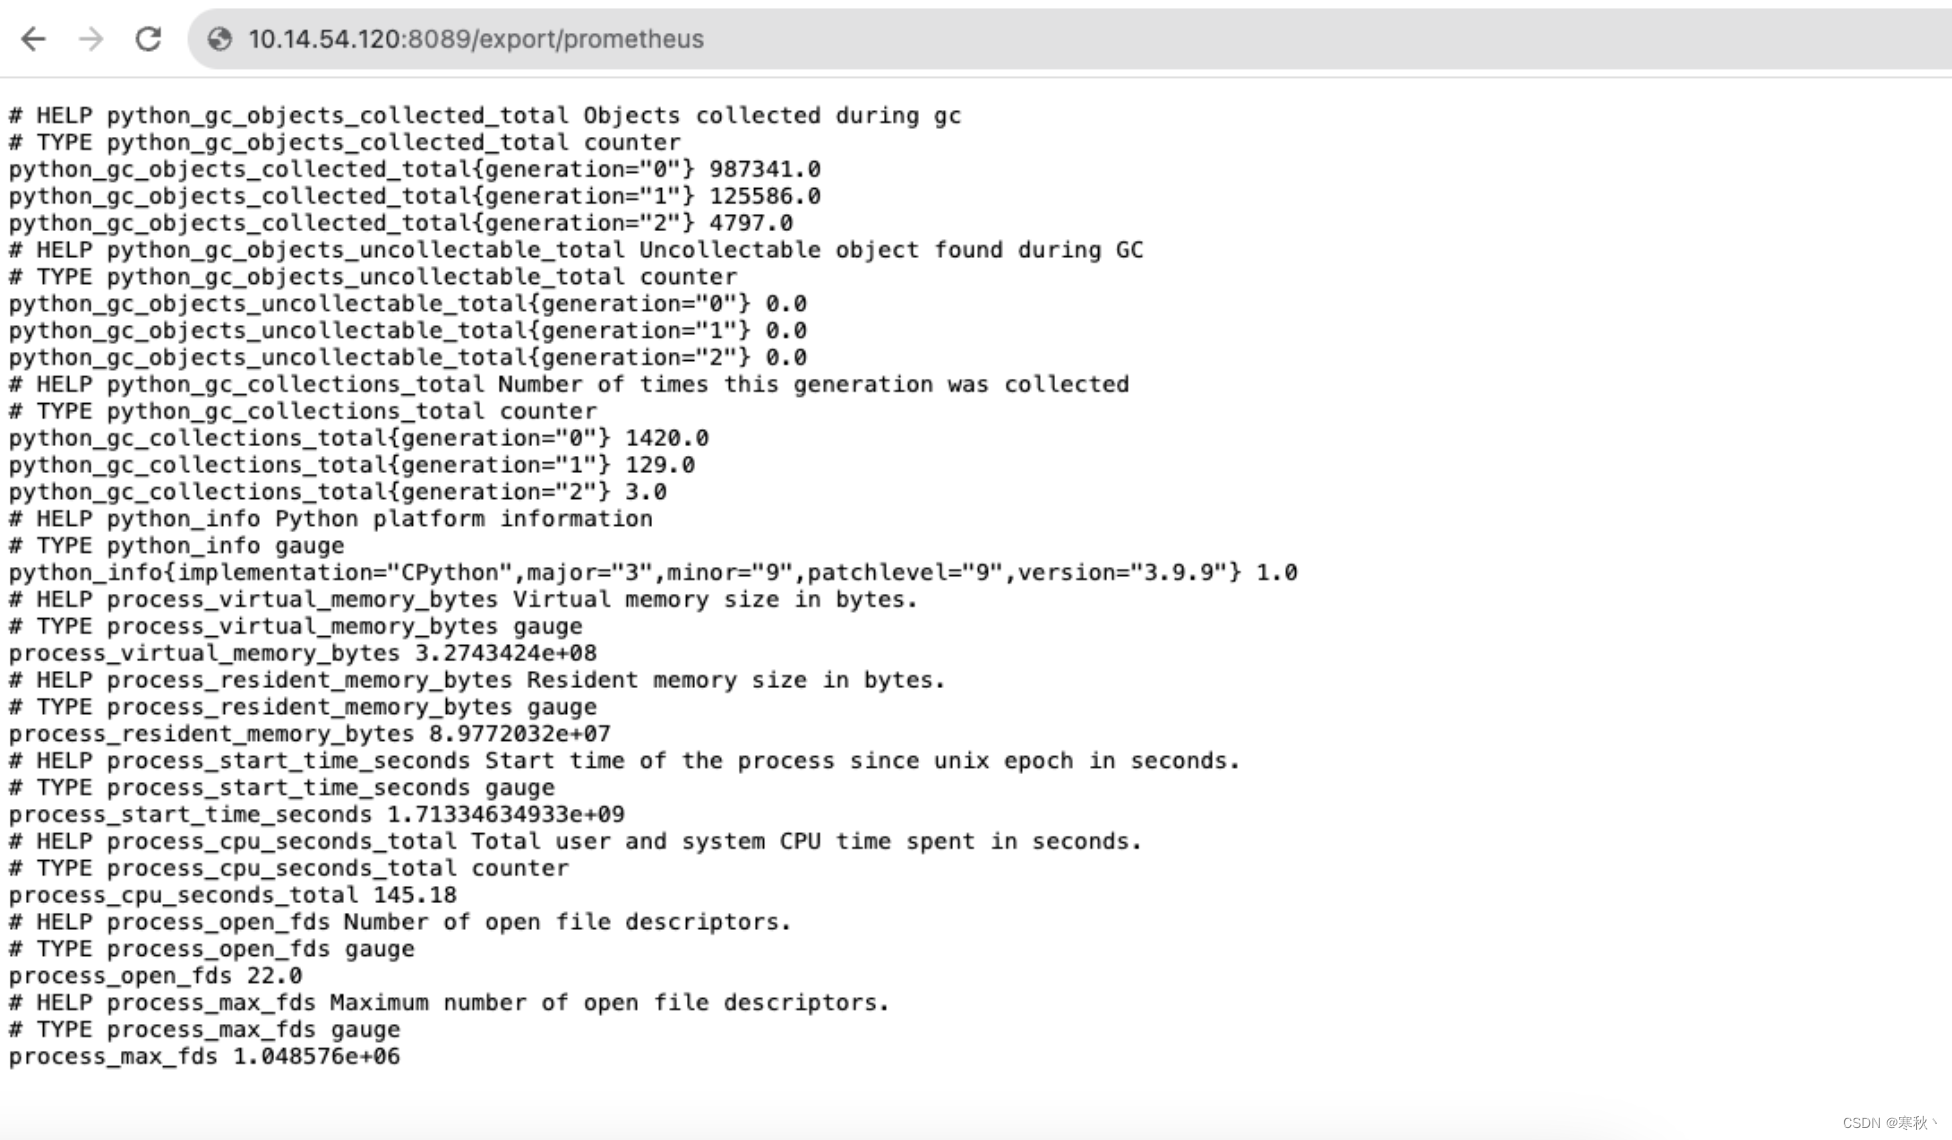
然后在浏览器输入http://master-ip:8089/export/prometheus
如果出现如下图的prometheus数据,表示master节点启动正确。
4、启动Prometheus
在master节点服务器上创建prometheus.yml配置文件,并且写入以下内容:
global:
  scrape_interval:     10s
  evaluation_interval: 10s

scrape_configs:
  - job_name: prometheus
    static_configs:
      - targets: ['localhost:9090']
        labels:
          instance: prometheus

  - job_name: locust

    metrics_path: '/export/prometheus'
    static_configs:
      - targets: ['locust_master:8089']  # 这里是locust的master节点启动命令中的network-alias后面的参数 + 内部端口,不要写外部映射的端口号
        labels:
          instance: locust
运行下面命令创建prometheus容器
docker run -d -p 9090:9090 -v $PWD/prometheus.yml:/etc/prometheus/prometheus.yml --name=prometheus --network=locust_network --network-alias=prometheus prom/prometheus
对于这条命令的解释:
docker run:运行一个 Docker 容器。

-d:以守护进程模式运行容器。

-p 9090:9090:将主机的 9090 端口映射到容器的 9090 端口。

-v $PWD/prometheus.yml:/etc/prometheus/prometheus.yml:将当前工作目录下的prometheus.yml文件挂载到容器的/etc/prometheus/prometheus.yml位置。

--name=prometheus:给容器命名为“prometheus”。

--network=locust_network:指定容器使用的网络为“locust_network”。

--network-alias=prometheus:为容器在网络中设置别名“prometheus”。

prom/prometheus:指定要使用的镜像为“prom/prometheus”
查看容器运行状态
docker ps -a
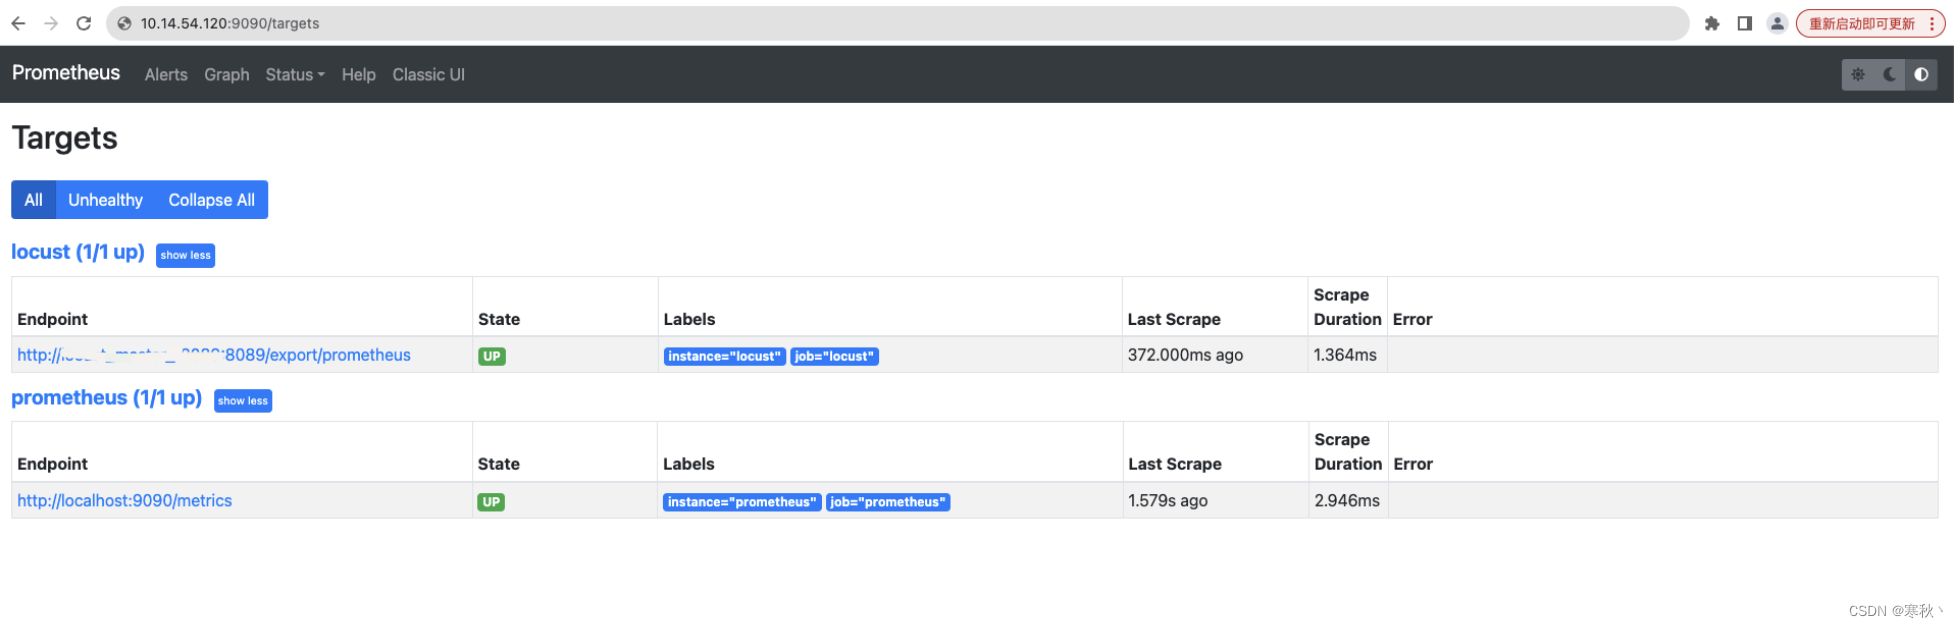
启动容器成功后进行验证
浏览器输入http://master-ip:9090/targets,出现如下页面,则代表服务运行正常。
5、启动Grafana
使用以下命令启动grafana容器
docker run -d -p 3000:3000 --name grafana --network=locust_network grafana/grafana
对于这条命令的解释:
docker run:启动一个 Docker 容器。

-d:表示在后台以守护进程的方式运行。

-p 3000:3000:将主机的 3000 端口映射到容器的 3000 端口。

--name grafana:给容器命名为“grafana”。

--network=locust_network:指定容器使用“locust_network”网络。

grafana/grafana:使用“grafana/grafana”镜像来创建容器。
浏览器输入http://master_ip:3000
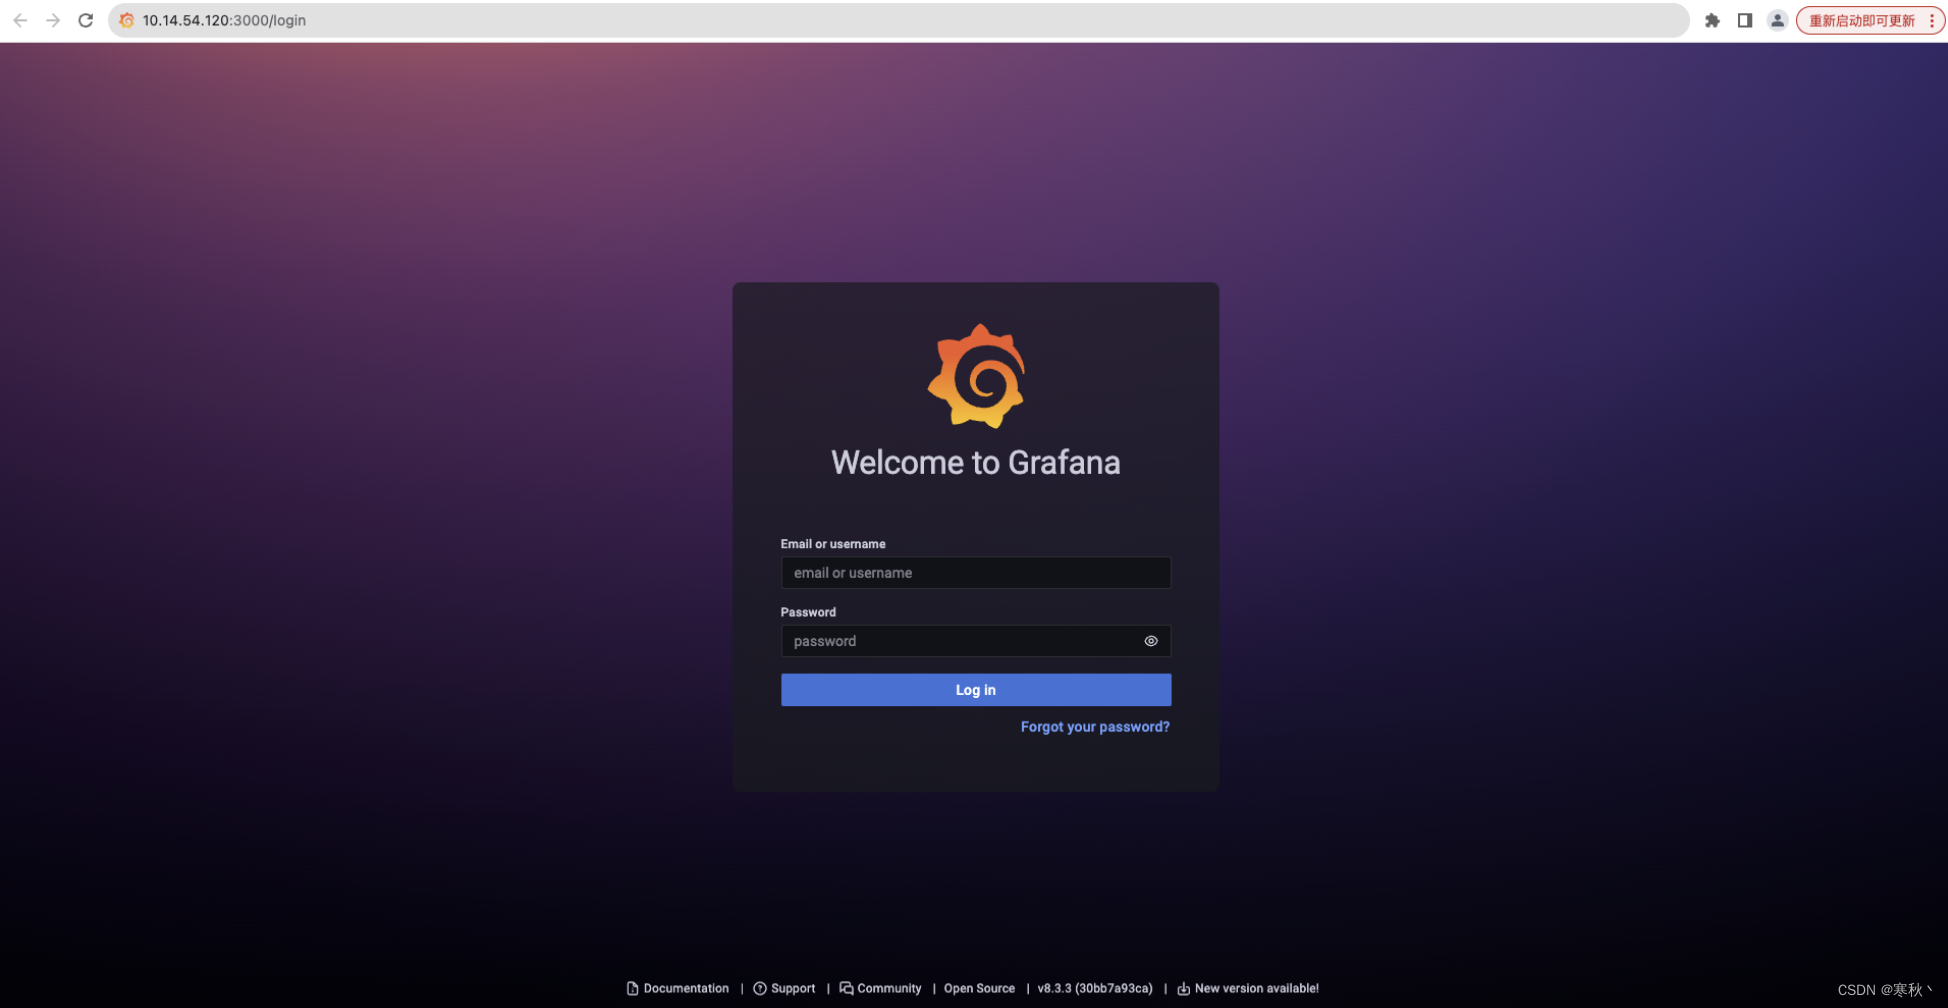
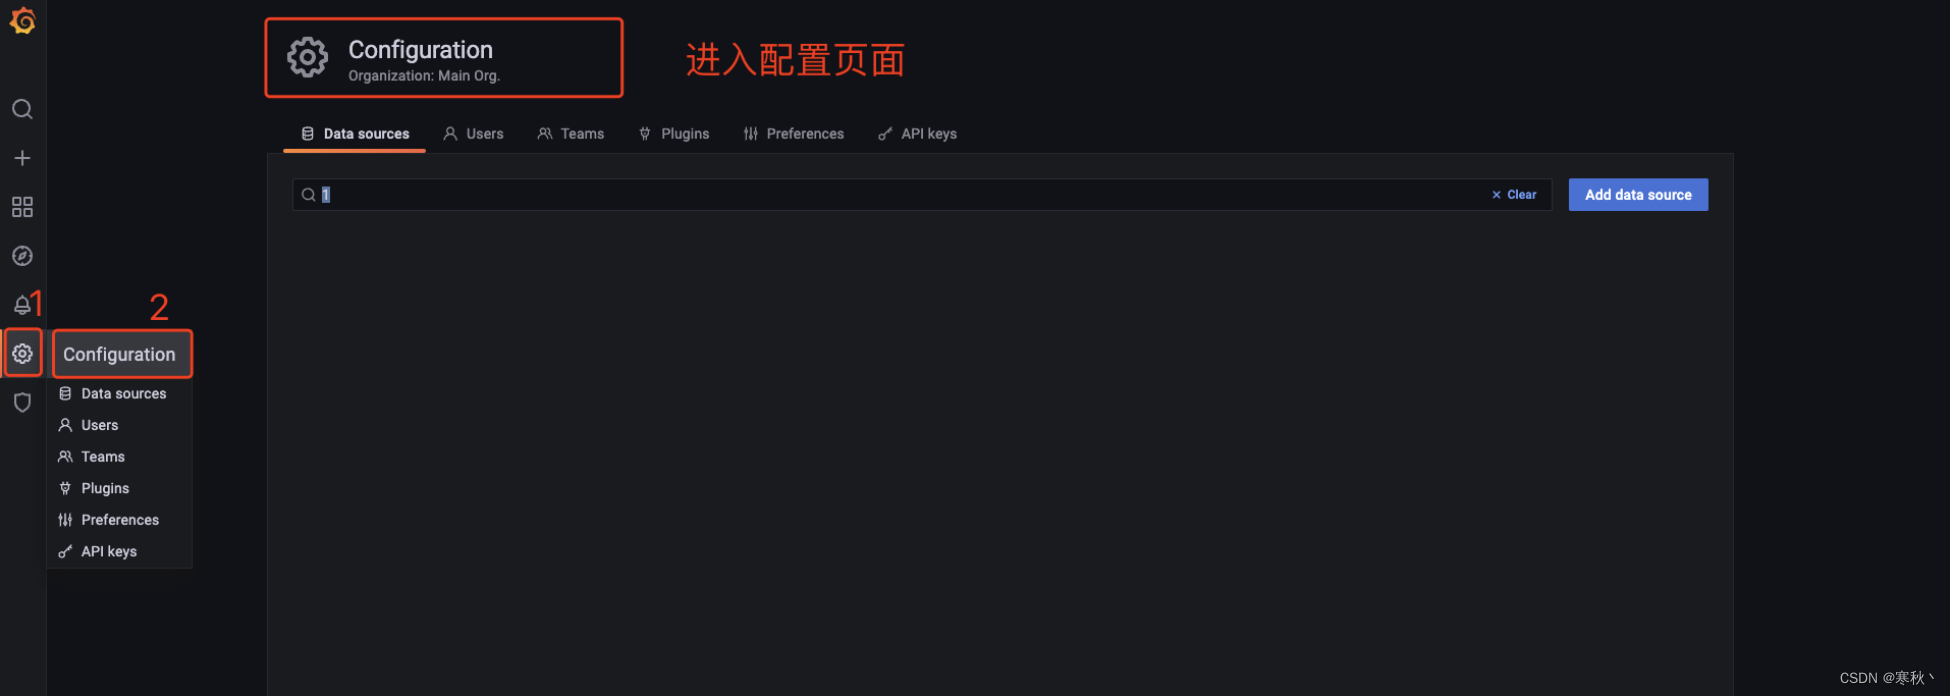
首次登录用户名和密码都是admin,进去了之后需要修改密码,登录后进入Configuration
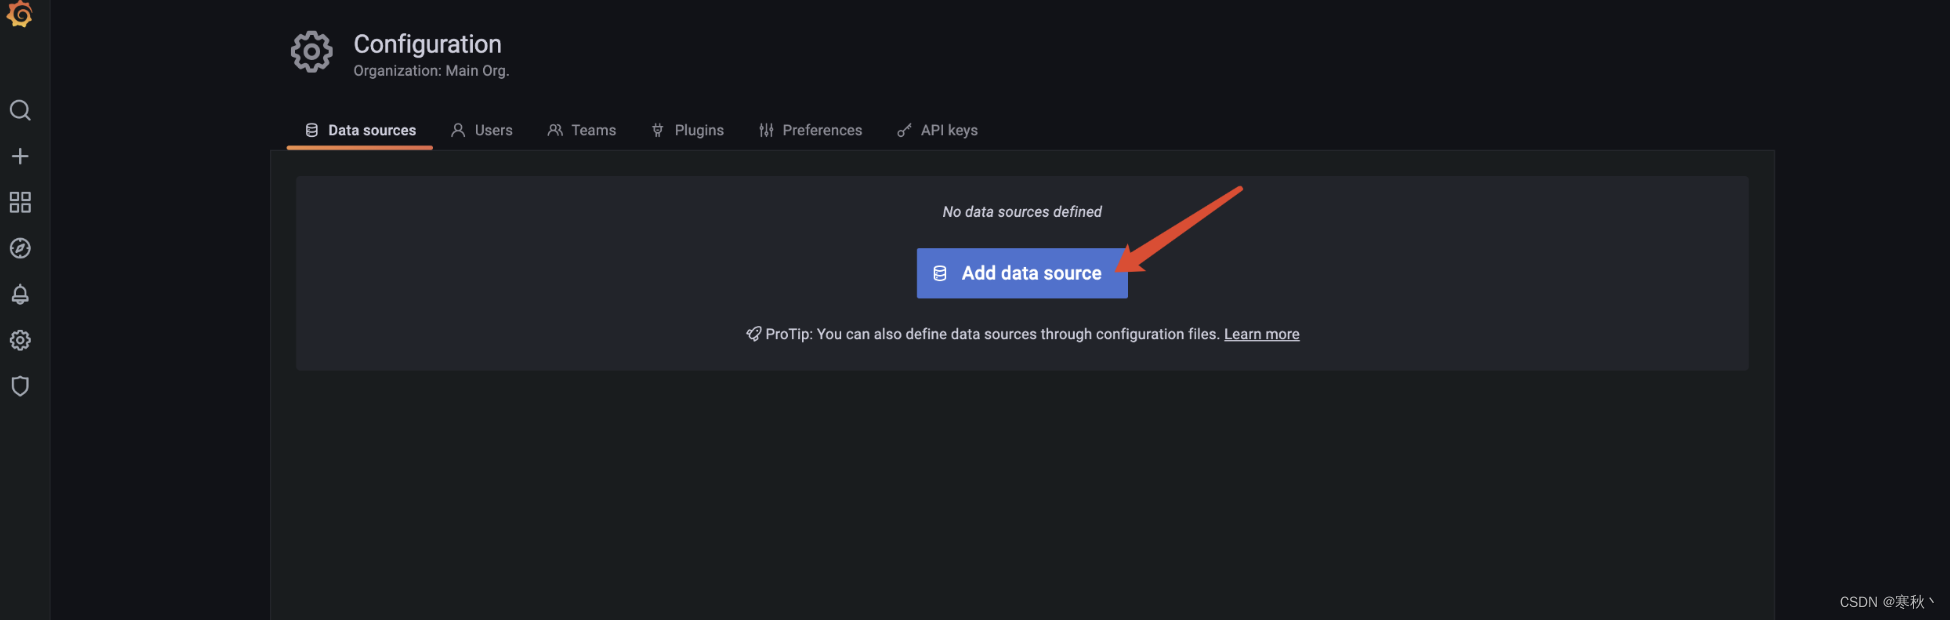
添加一个数据源。
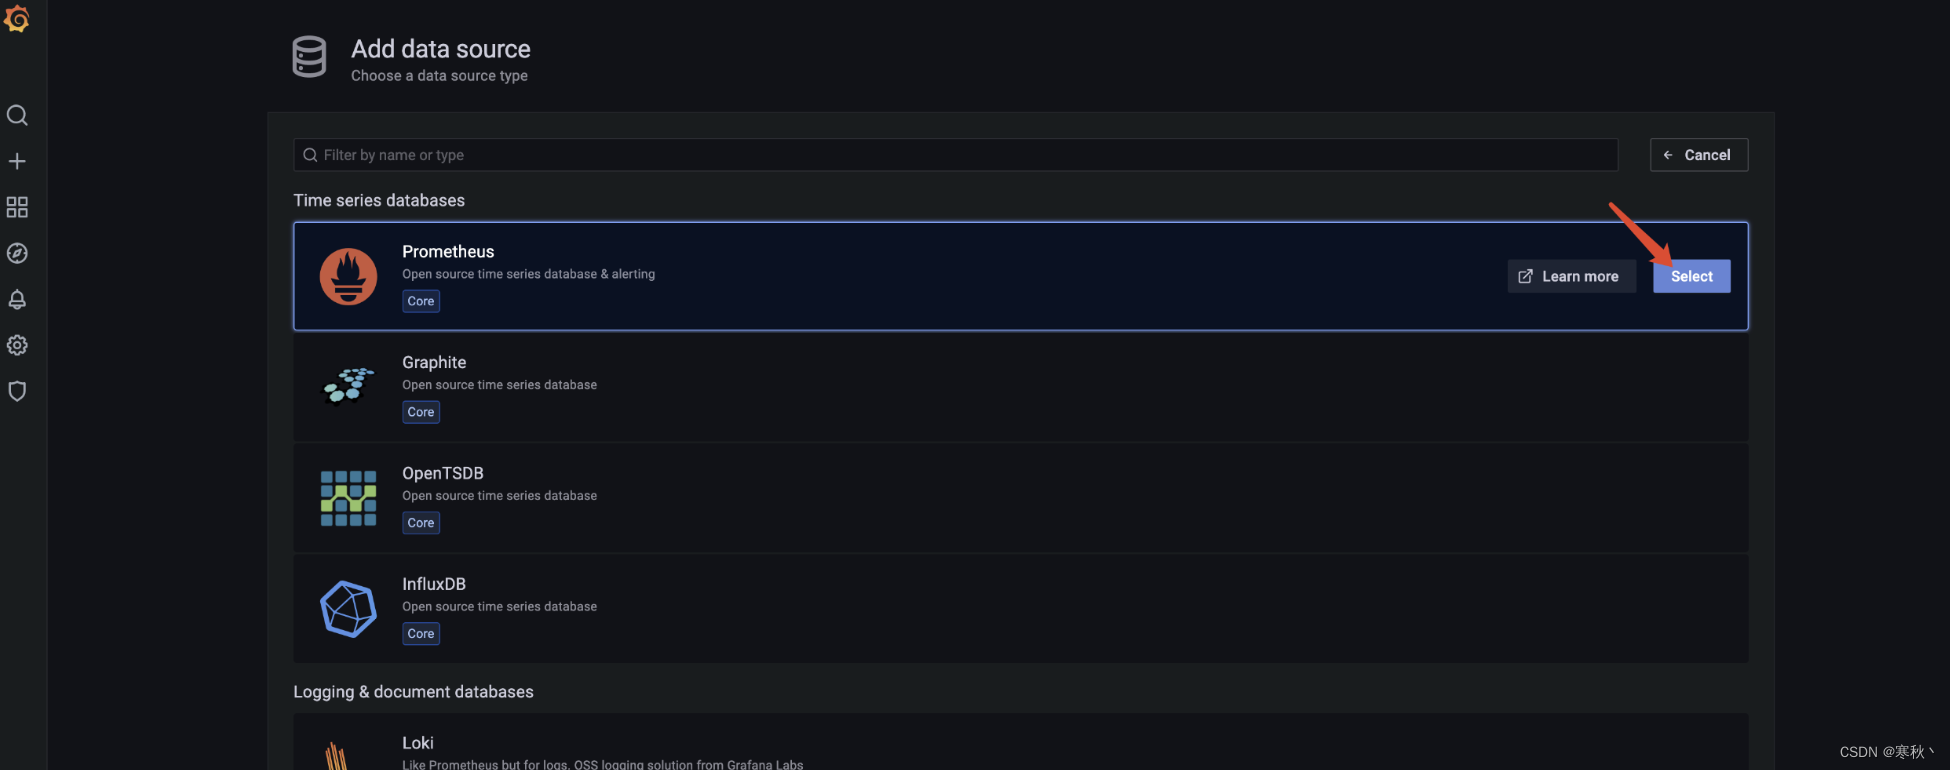
选择数据源为prometheus。
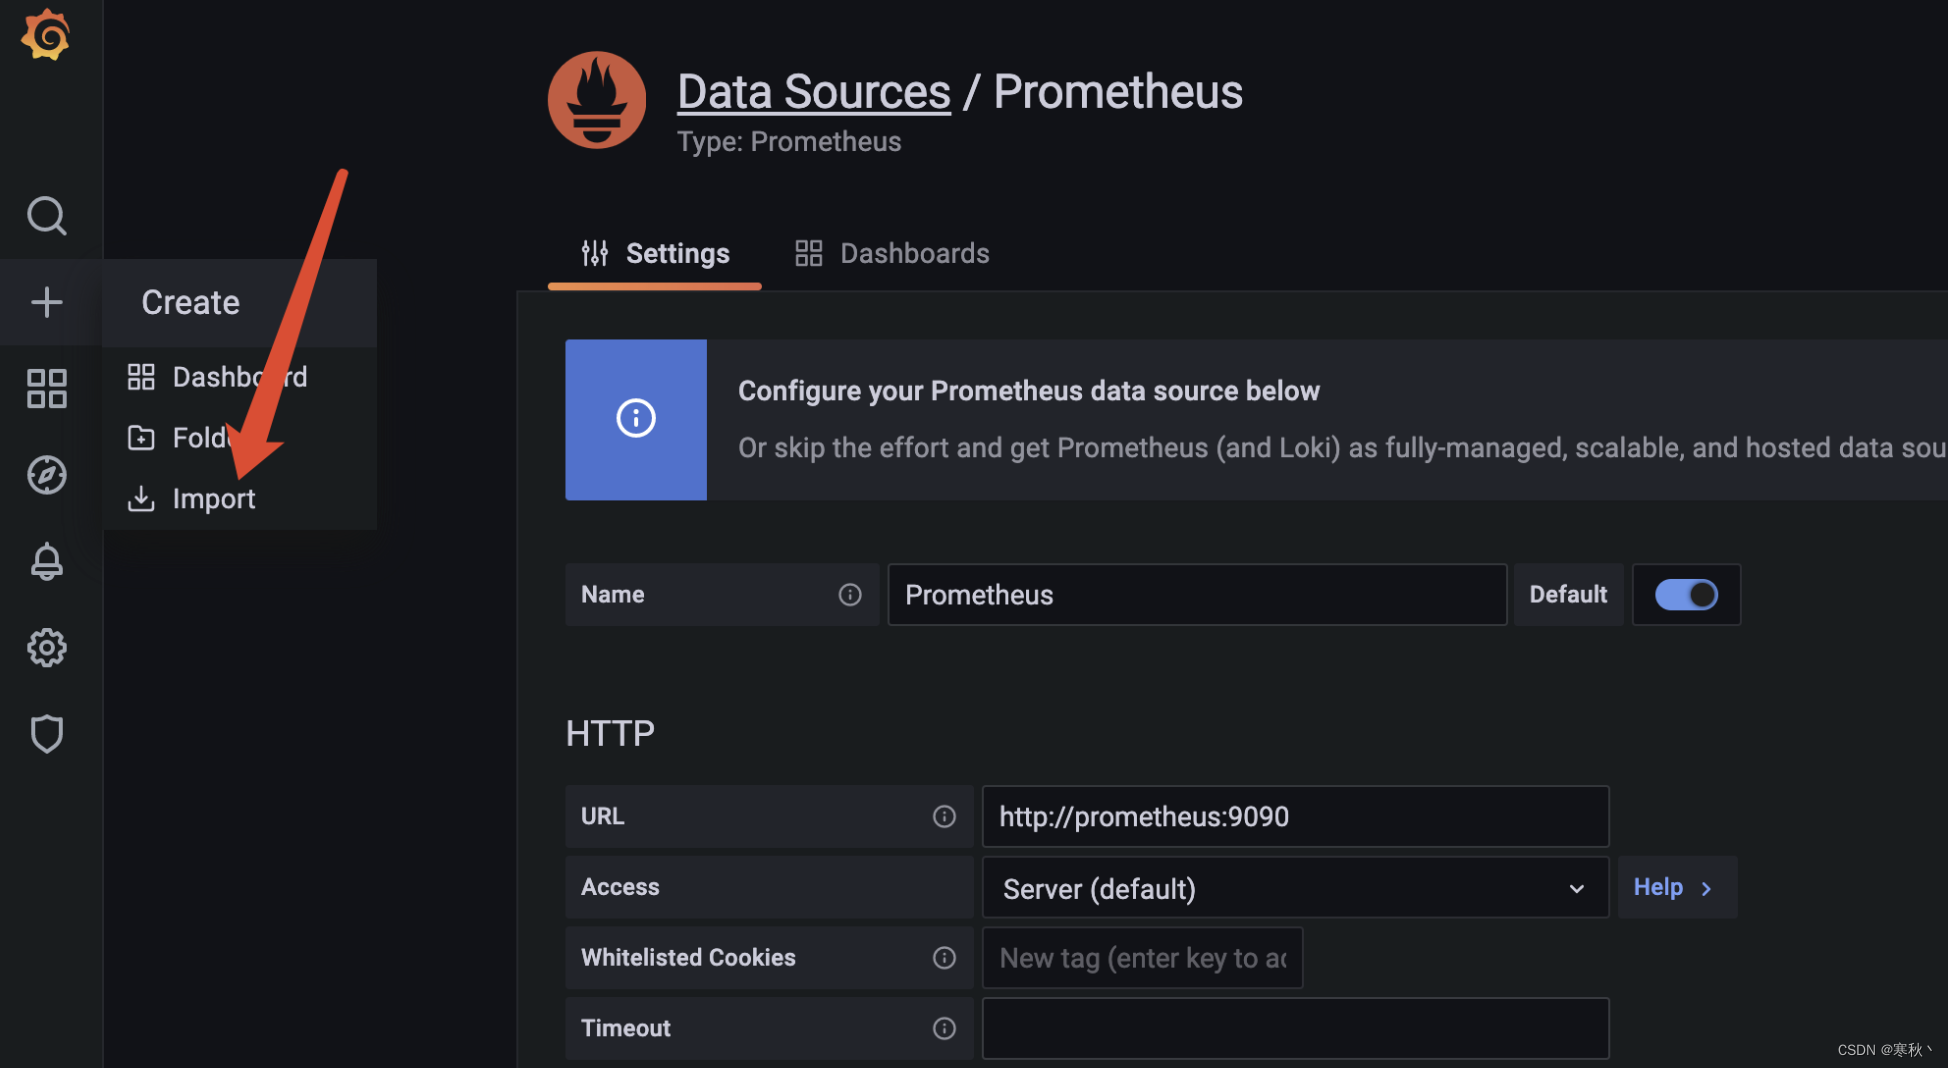
配置数据源的url,url处输入创建prometheus容器时的–network-alias的别名:9090,所以此处需要填写http://prometheus:9090。

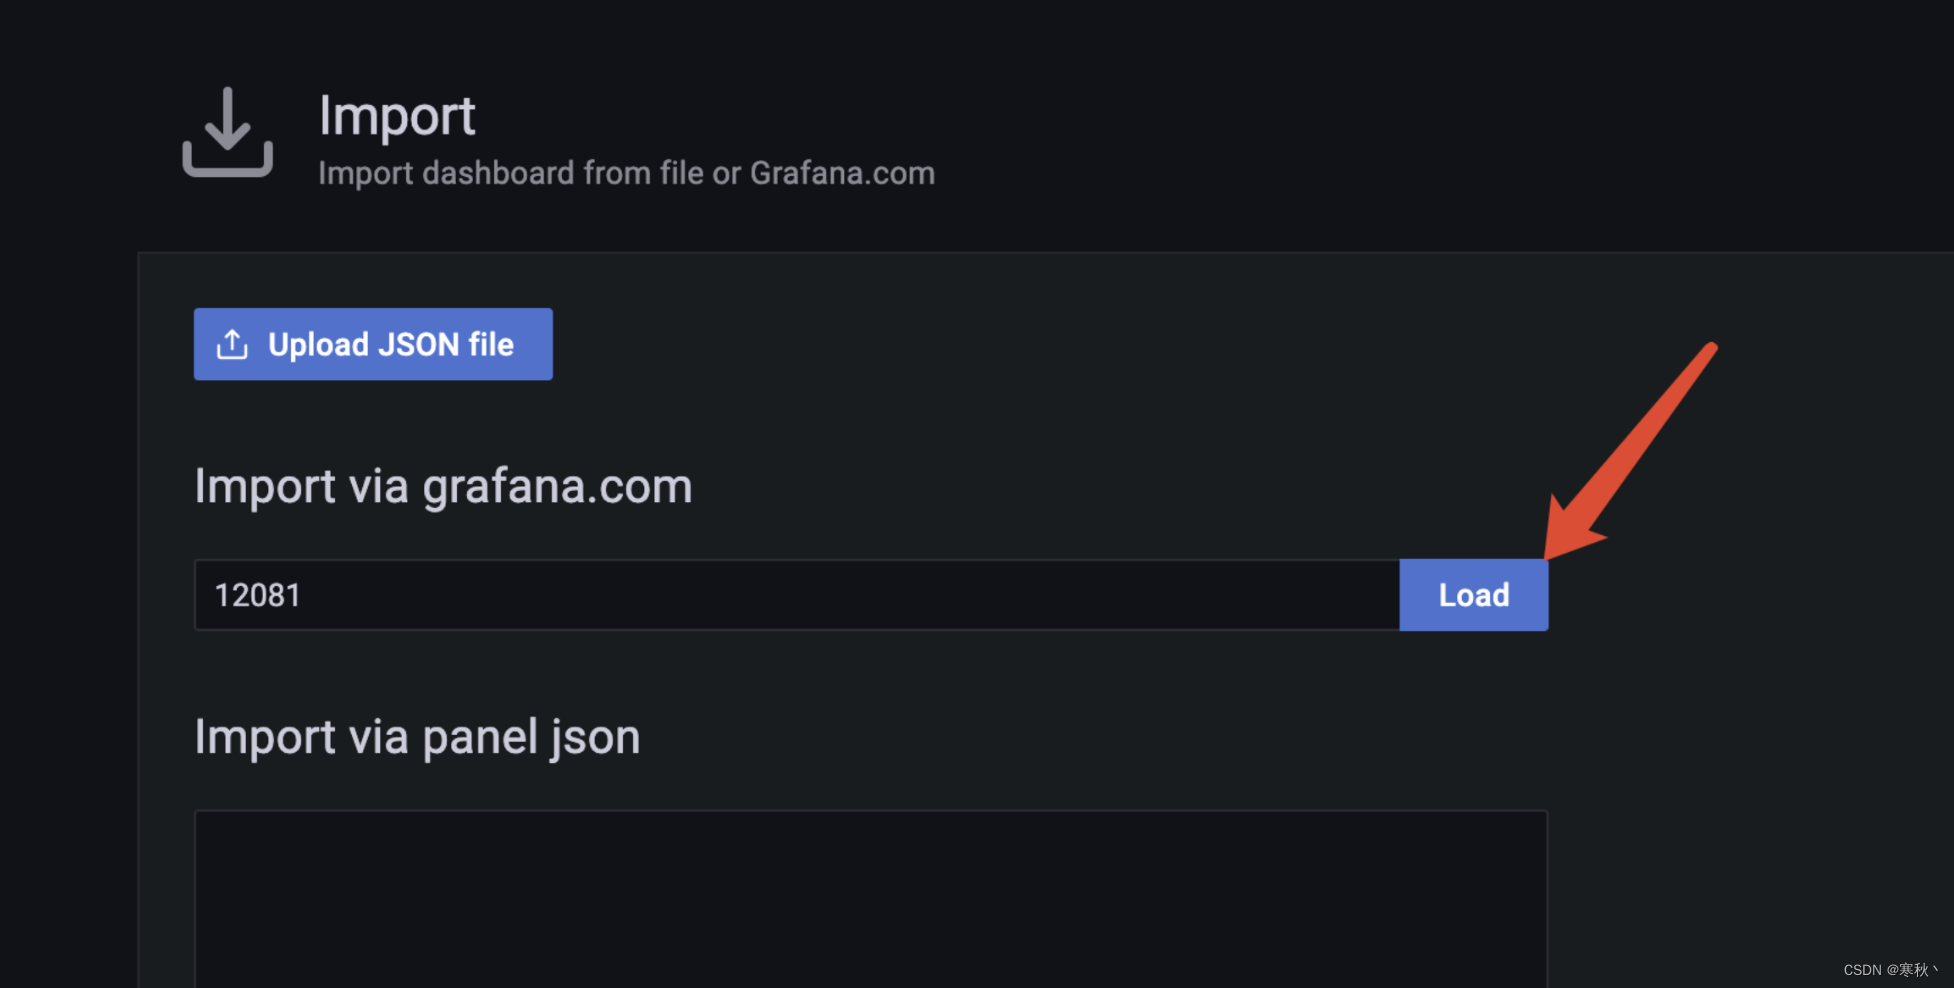
导入仪表盘模版。
输入id为12081,点击load,来加载locust性能测试的仪表盘模版。
选择完仪表盘模版后选择数据源,选择prometheus,点击import。
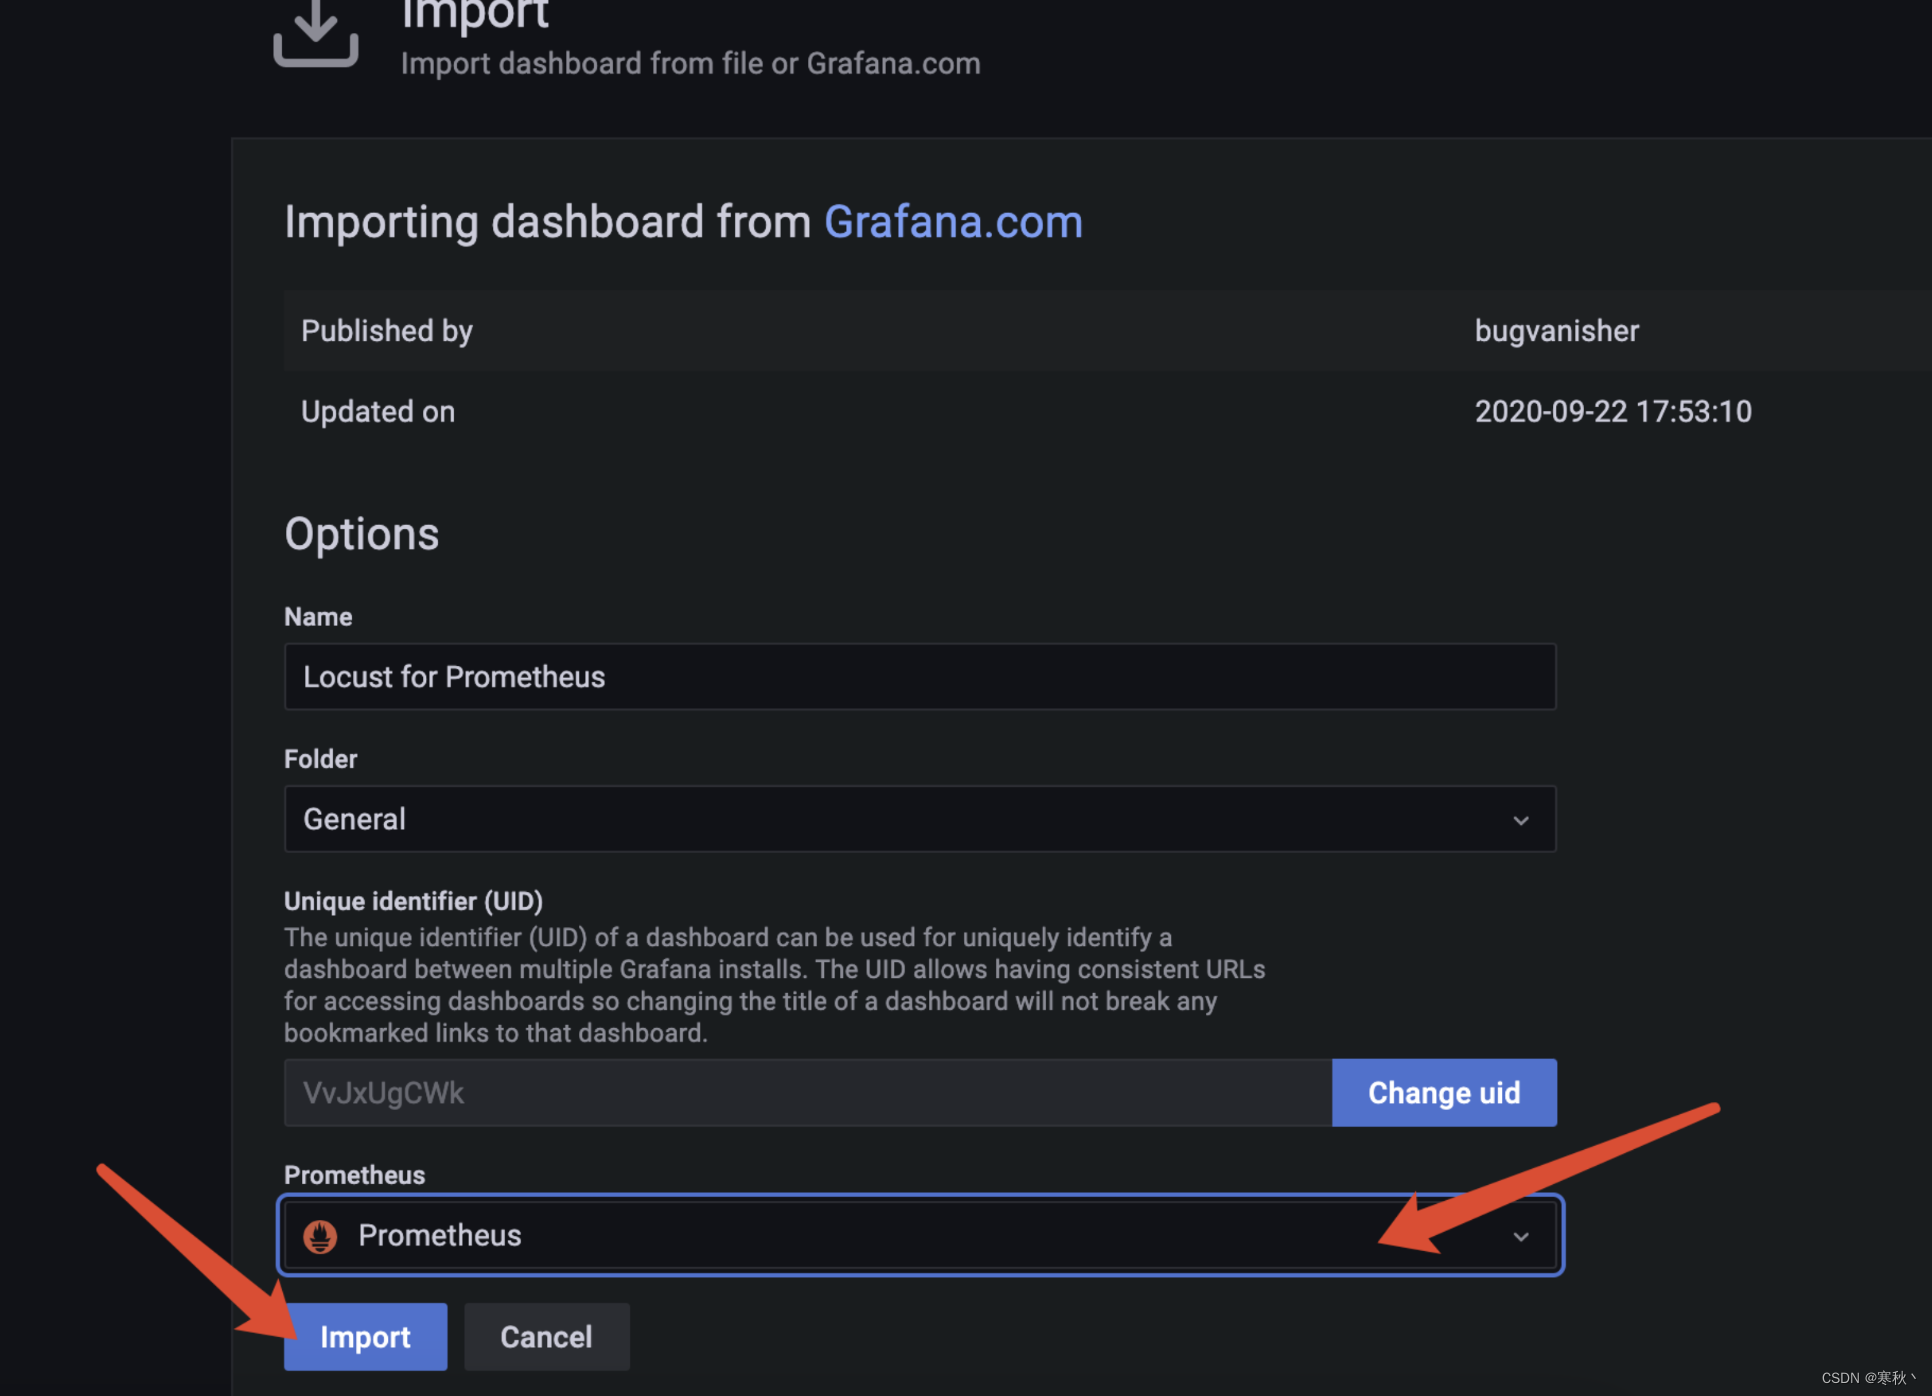
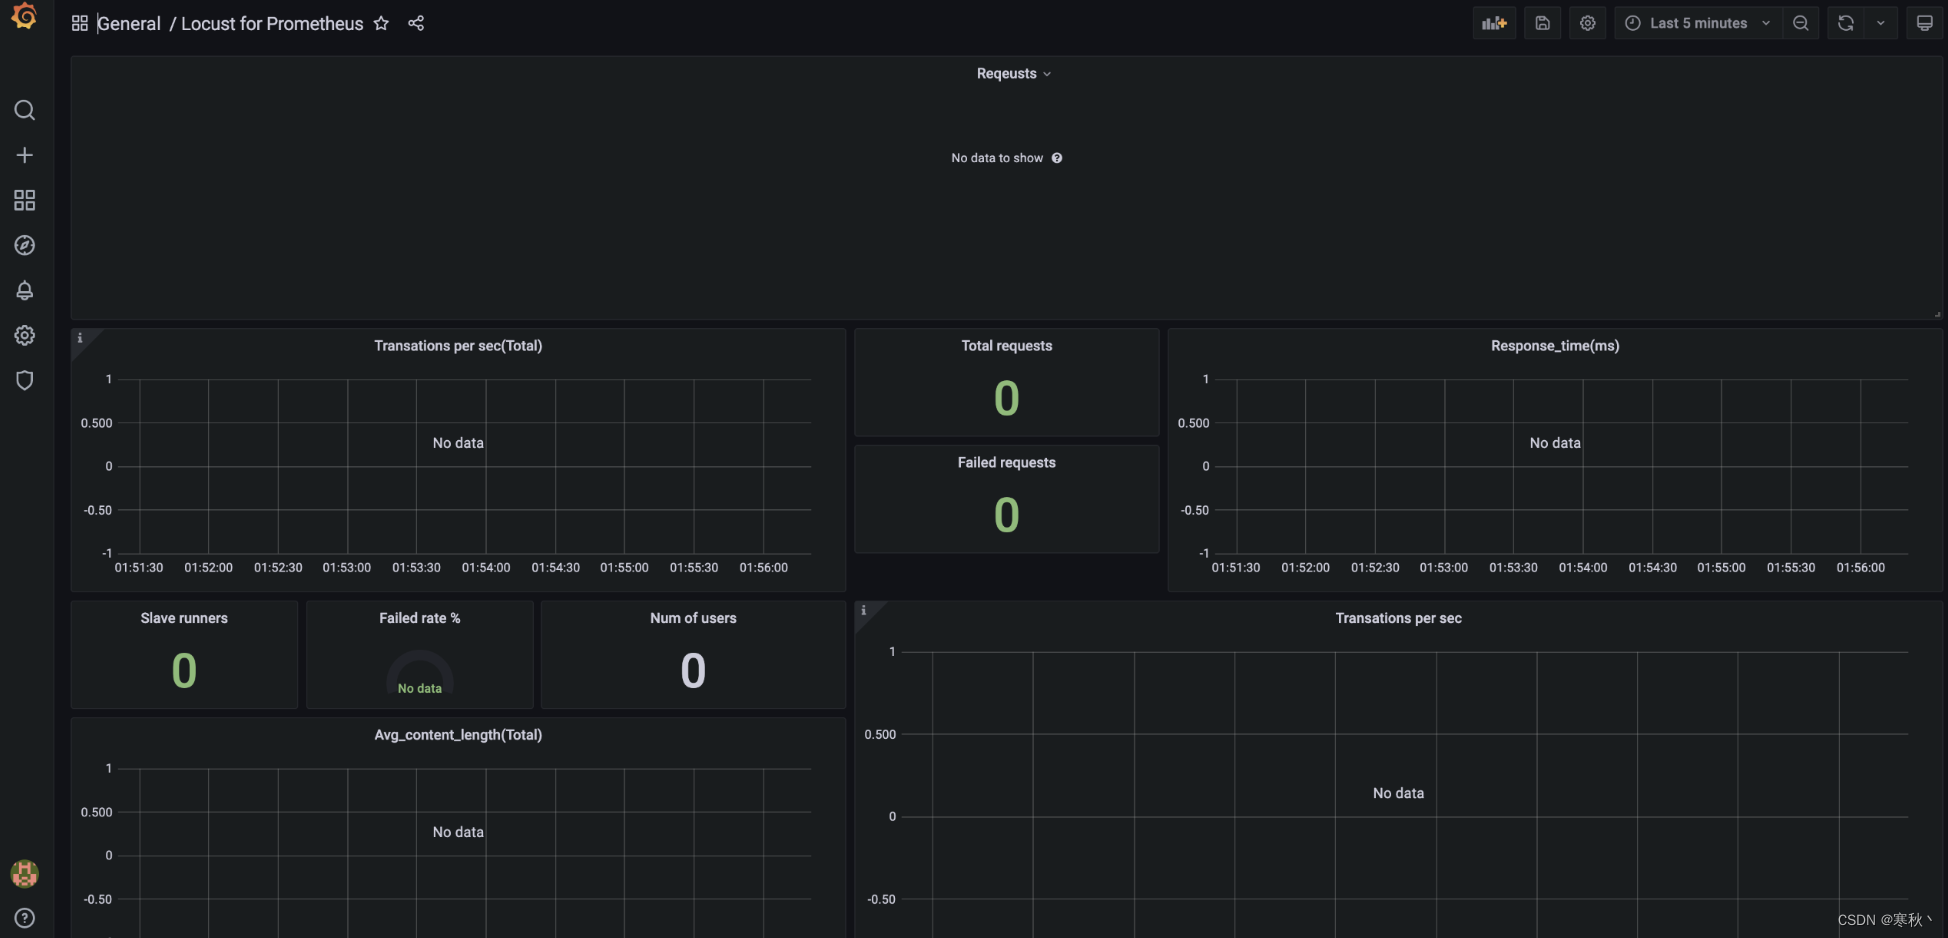
导入成功后,出现如下页面,此时通过locust执行测试的数据将会展示在仪表盘中。
关于启动用户数的图表配置:
id为12081的这个模版中缺少Locust的用户数量指标,需要额外进行创建。
点击仪表盘上方添加图表按钮
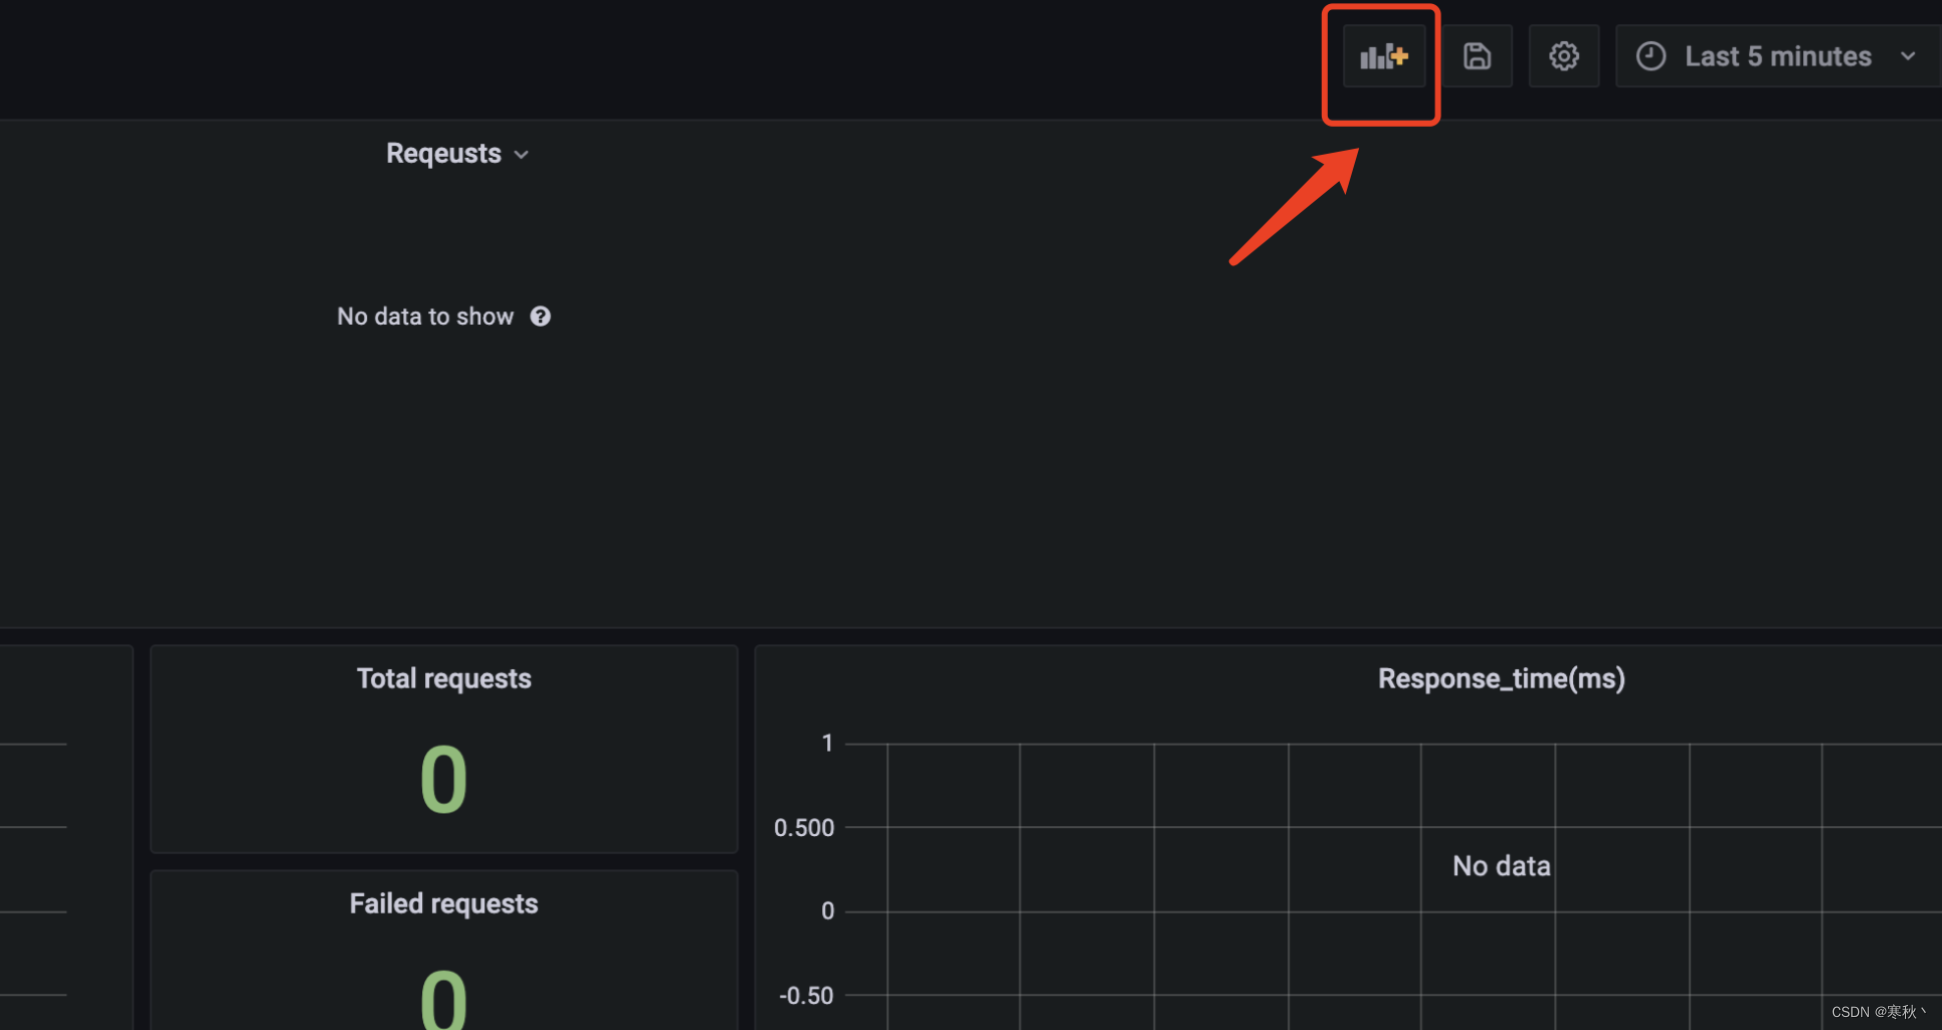
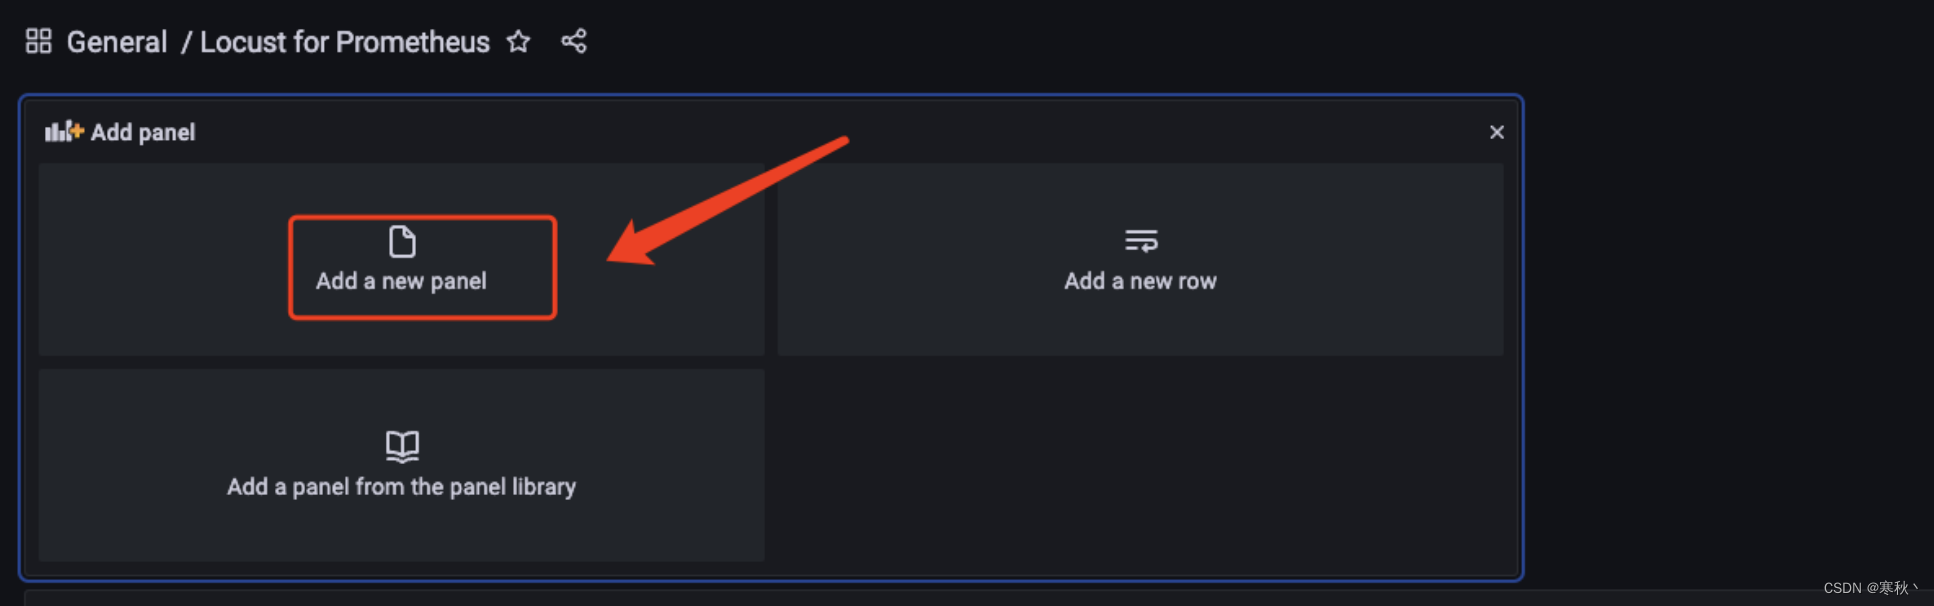
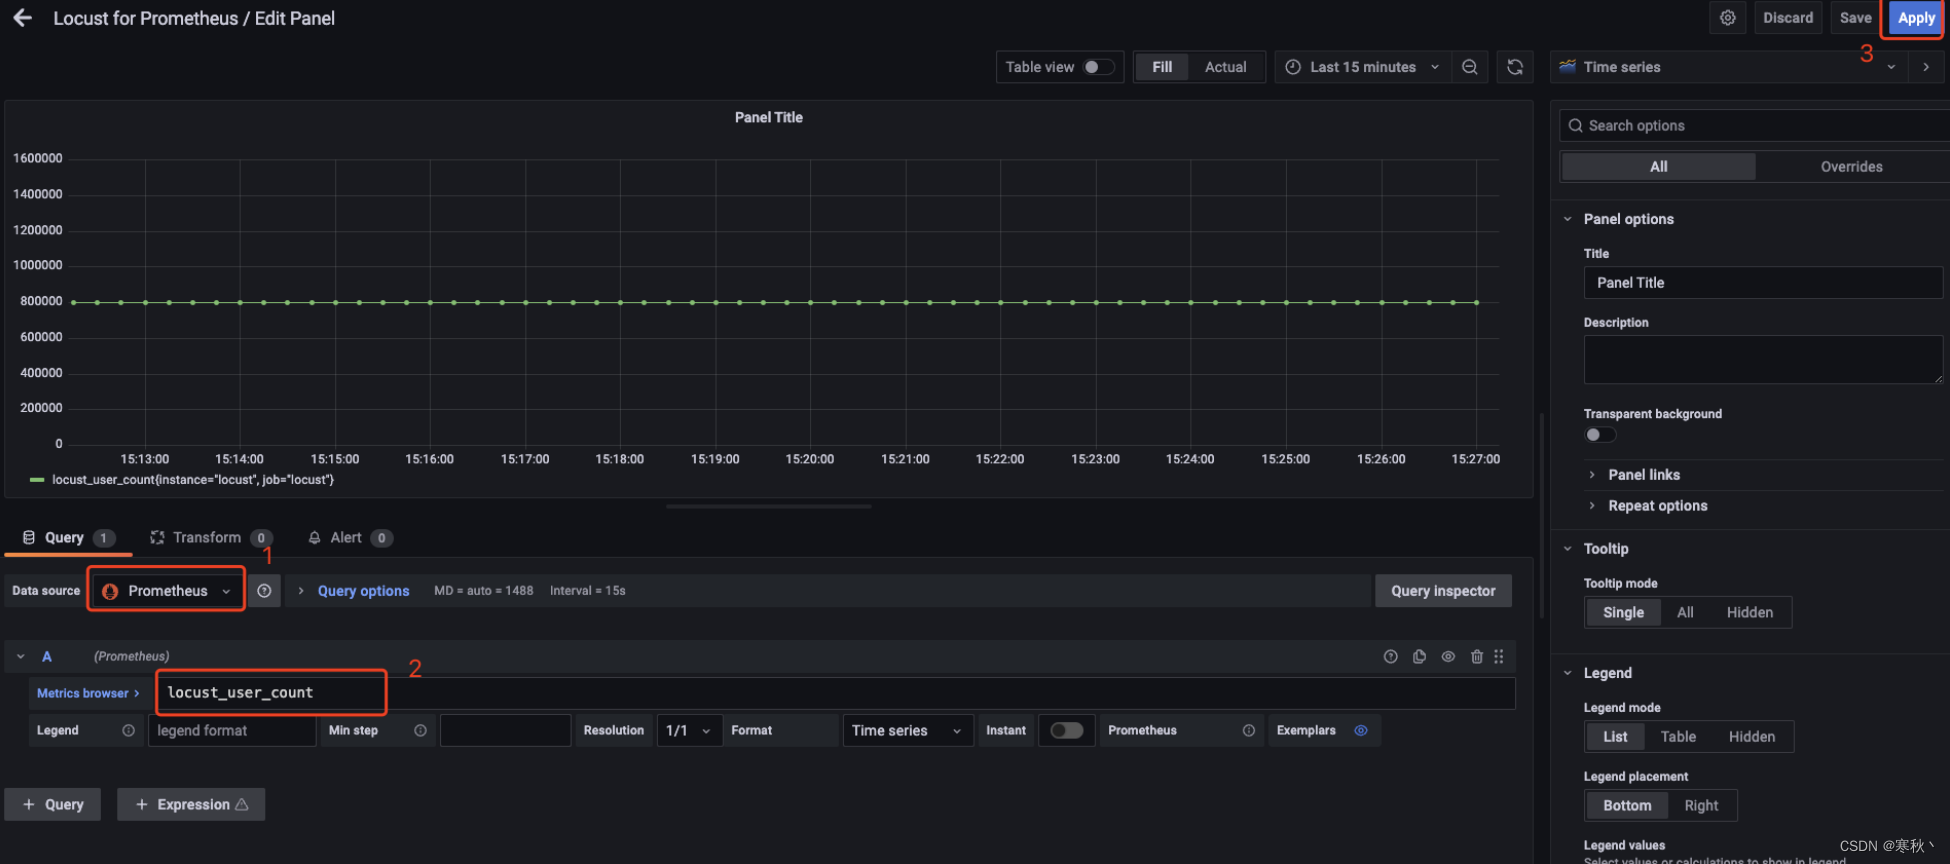
数据源选择prometheus,然后下方的Metrics browser处填写locust_user_count,最后点击右上角的Apply,此时仪表盘中会显示启动用户数据。
三、部署Locust的Worker节点
关于Locust压测脚本编写有很多种方式,需要具备一定的python编程基础,可以参照:
使用Python3 + Locust进行性能测试
worker节点启动的py文件是压测需要的业务代码。
以下是一个单接口压测的例子:
# -*- coding:utf-8 -*-
from locust import User, task, events
import requests
import time
import json

__doc__ = '埋点接口压测脚本'


class Dummy(User):

    @task
    def send_lingge_burying_point(self):
        """
        发送埋点接口
        """
        api_url = 'https://app.xxxxxxxxx.cn/app_v1/advert/dataBack'
        headers = {'Content-Type': 'application/x-www-form-urlencoded'}
        request_data = {'androidid': '0', 'appType': 'ios-app-user', 'appVersion': '1.61.0', 'channel': 'ios-official',
                        'deviceBrand': 'iPhone', 'deviceModel': 'iPhone XS',
                        'equipmentId': '09bf8295234a91723908172394635c98f', 'eventName': 'obtainLocationInformation',
                        'eventParam': json.dumps({"cityCode": "110000"}), 'idfa': '00000000-0000-0000-0000-000000000000',
                        'interfaceType': 'event', 'mac': '0', 'oaid': '0', 'osType': 'iOS', 'platform': 'ios',
                        'systemVersion': '15.5'}
        start_time = time.time()
        try:
            response = requests.post(url=api_url, params=request_data, headers=headers)
            response_text = json.loads(response.text)
            total_time = int((time.time() - start_time) * 1000)
            if response_text['success'] is True:
                events.request_success.fire(request_type="HTTPS", name="埋点接口-成功", response_time=total_time, response_length=len(response_text))
            else:
                events.request_failure.fire(request_type="HTTPS", name="埋点接口-失败", response_time=total_time, response_length=len(response_text))
        except Exception as e:
            total_time = int((time.time() - start_time) * 1000)
            events.request_failure.fire(request_type="HTTPS", name="埋点接口-错误", response_time=total_time, exception=f'埋点接口错误:{e}', response_length=0)
文件名称为locust_burial_point.py
将locust_burial_point.py上传到服务器,然后执行下面命令,来启动worker节点。
docker run -d -v $PWD/locust_worker.py:/mnt/locust/locustfile.py --name=locust_worker --network=locust_network locustio/locust -f /mnt/locust/locustfile.py --worker --master-host locust_master --master-port 5557
对于这条命令的解释:
docker run:运行 Docker 容器。

-d:以守护进程模式运行。

-v $PWD/locust_worker.py:/mnt/locust/locustfile.py:将当前工作目录下的locust_worker.py文件挂载到容器内的/mnt/locust/locustfile.py位置。

--name=locust_worker:给容器命名为“locust_worker”。

--network=locust_network:指定容器使用“locust_network”网络。

locustio/locust:使用“locustio/locust”镜像。

-f /mnt/locust/locustfile.py:指定要运行的文件为/mnt/locust/locustfile.py。

--worker:以工作节点模式运行。

--master-host locust_master:指定主节点的主机名。

--master-port 5557:指定主节点的端口号。
启动成功后,查看容器运行状态。
docker ps -a
此时Master和Worker节点都已经正确启动,进入master节点的Locust web页面,可以看到worker数变为了1。

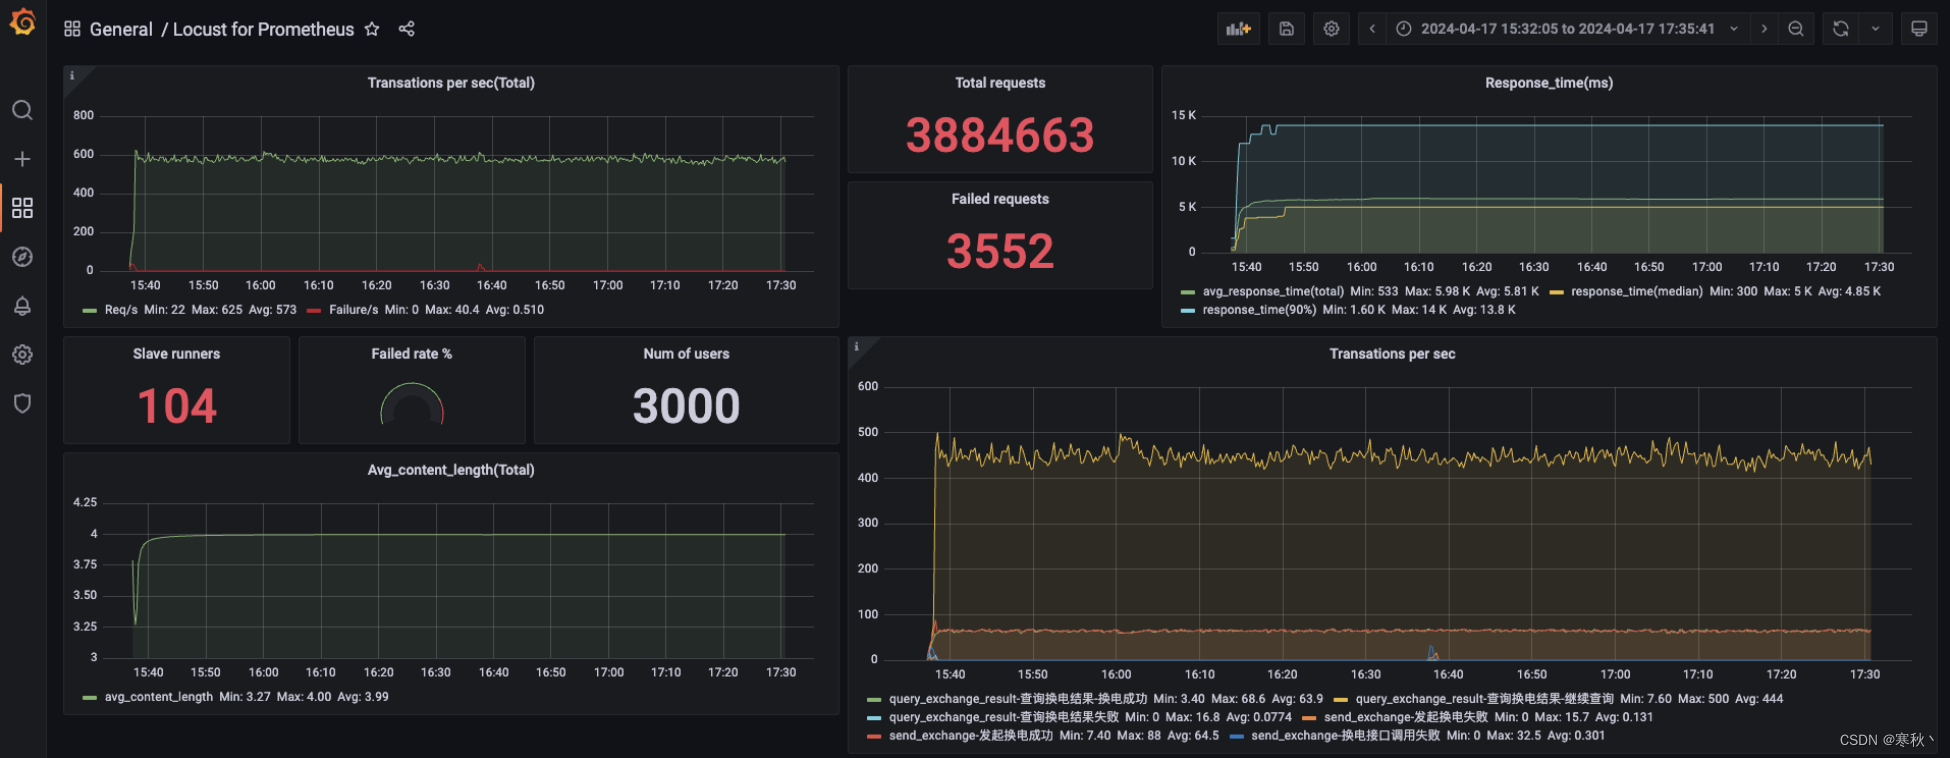
到此,大功告成,可以输入总用户数和每秒启动数来进行压测了,压测过程中,可以通过grafana的仪表盘分析测试过程与结果。
在此处贴一张我前段时间压测过程中的图:
四、搭建docker私有仓库(扩展)
1、修改/etc/docker/daemon.json文件,添加信任。
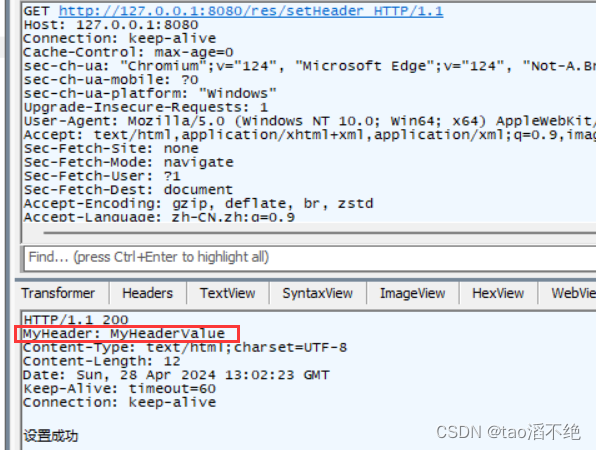
将以下内容添加到文件中
"insecure-registries":["http://master-ip:8080"]
2、重新加载并且重启docker
# 重加载
systemctl daemon-reload
# 重启docker
systemctl restart docker
3、部署带有图象界面的DockerRegistry容器,用来管理镜像。
创建registry-ui目录,并且进入到目录中。
mkdir registry-ui && cd registry-ui
创建docker-compose.yml文件。
touch docker-compose.yml
将以下内容写入docker-compose.yml,REGISTRY_URL需要修改为服务器的ip地址,然后保存文件。
version: '3.0'
services:
  registry:
    image: registry
    volumes:
      - ./registry-data:/var/lib/registry
  ui:
    image: joxit/docker-registry-ui:static
    ports:
      - 8080:80
    environment:
      - REGISTRY_TITLE=这是一个性能测试镜像仓库
      - REGISTRY_URL=http://master_ip:5000
    depends_on:
      - registry
在registry-ui目录中启动。
docker-compose up -d
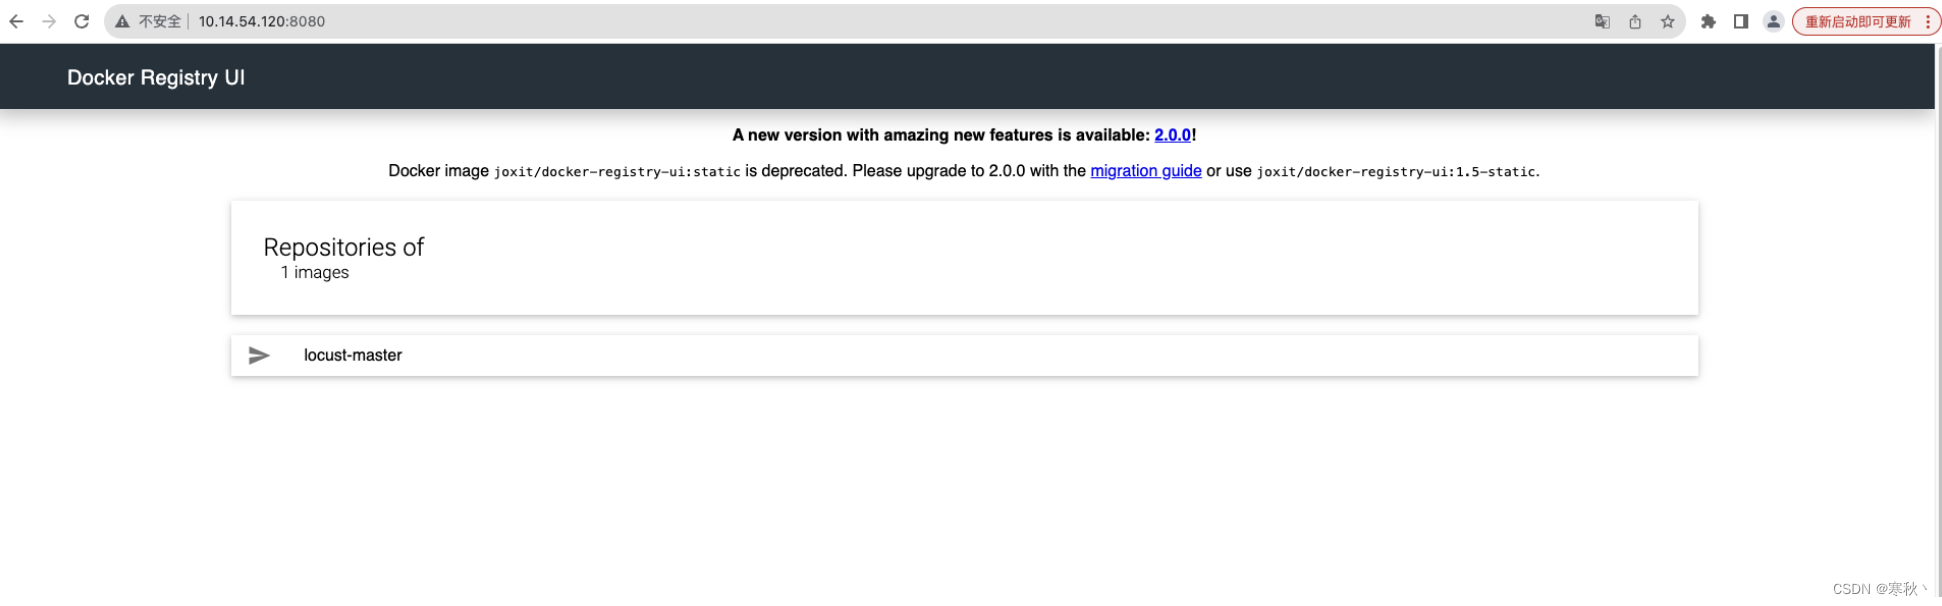
启动成功后访问http://master_ip:8080,出现下图则代表启动成功。
最后,关于如何创建镜像、上传下载镜像等,以及docker的常用命令,大家可以阅读:Docker常用命令
希望本文能给大家的测试工作带来一定的帮助,谢谢~